
By Preserve Gold Research
The old one-paycheck household has become an awkward topic for many Americans. It was never universal, and it certainly wasn’t shared equally across race, gender, and geography. But it also wasn’t fantasy. U.S. Census and HUD data put the median home sale price at $403,200 in the first quarter of 2026. In the first quarter of 1970, the same series put it at $23,900. Median family income was $9,867 that year. Wages haven’t been standing still, and none of that corrects for genuine gains over half a century. But the ratio has shifted. The distance between ordinary earnings and middle-class stability has widened, and for a growing share of Americans, the gap now runs in the wrong direction.
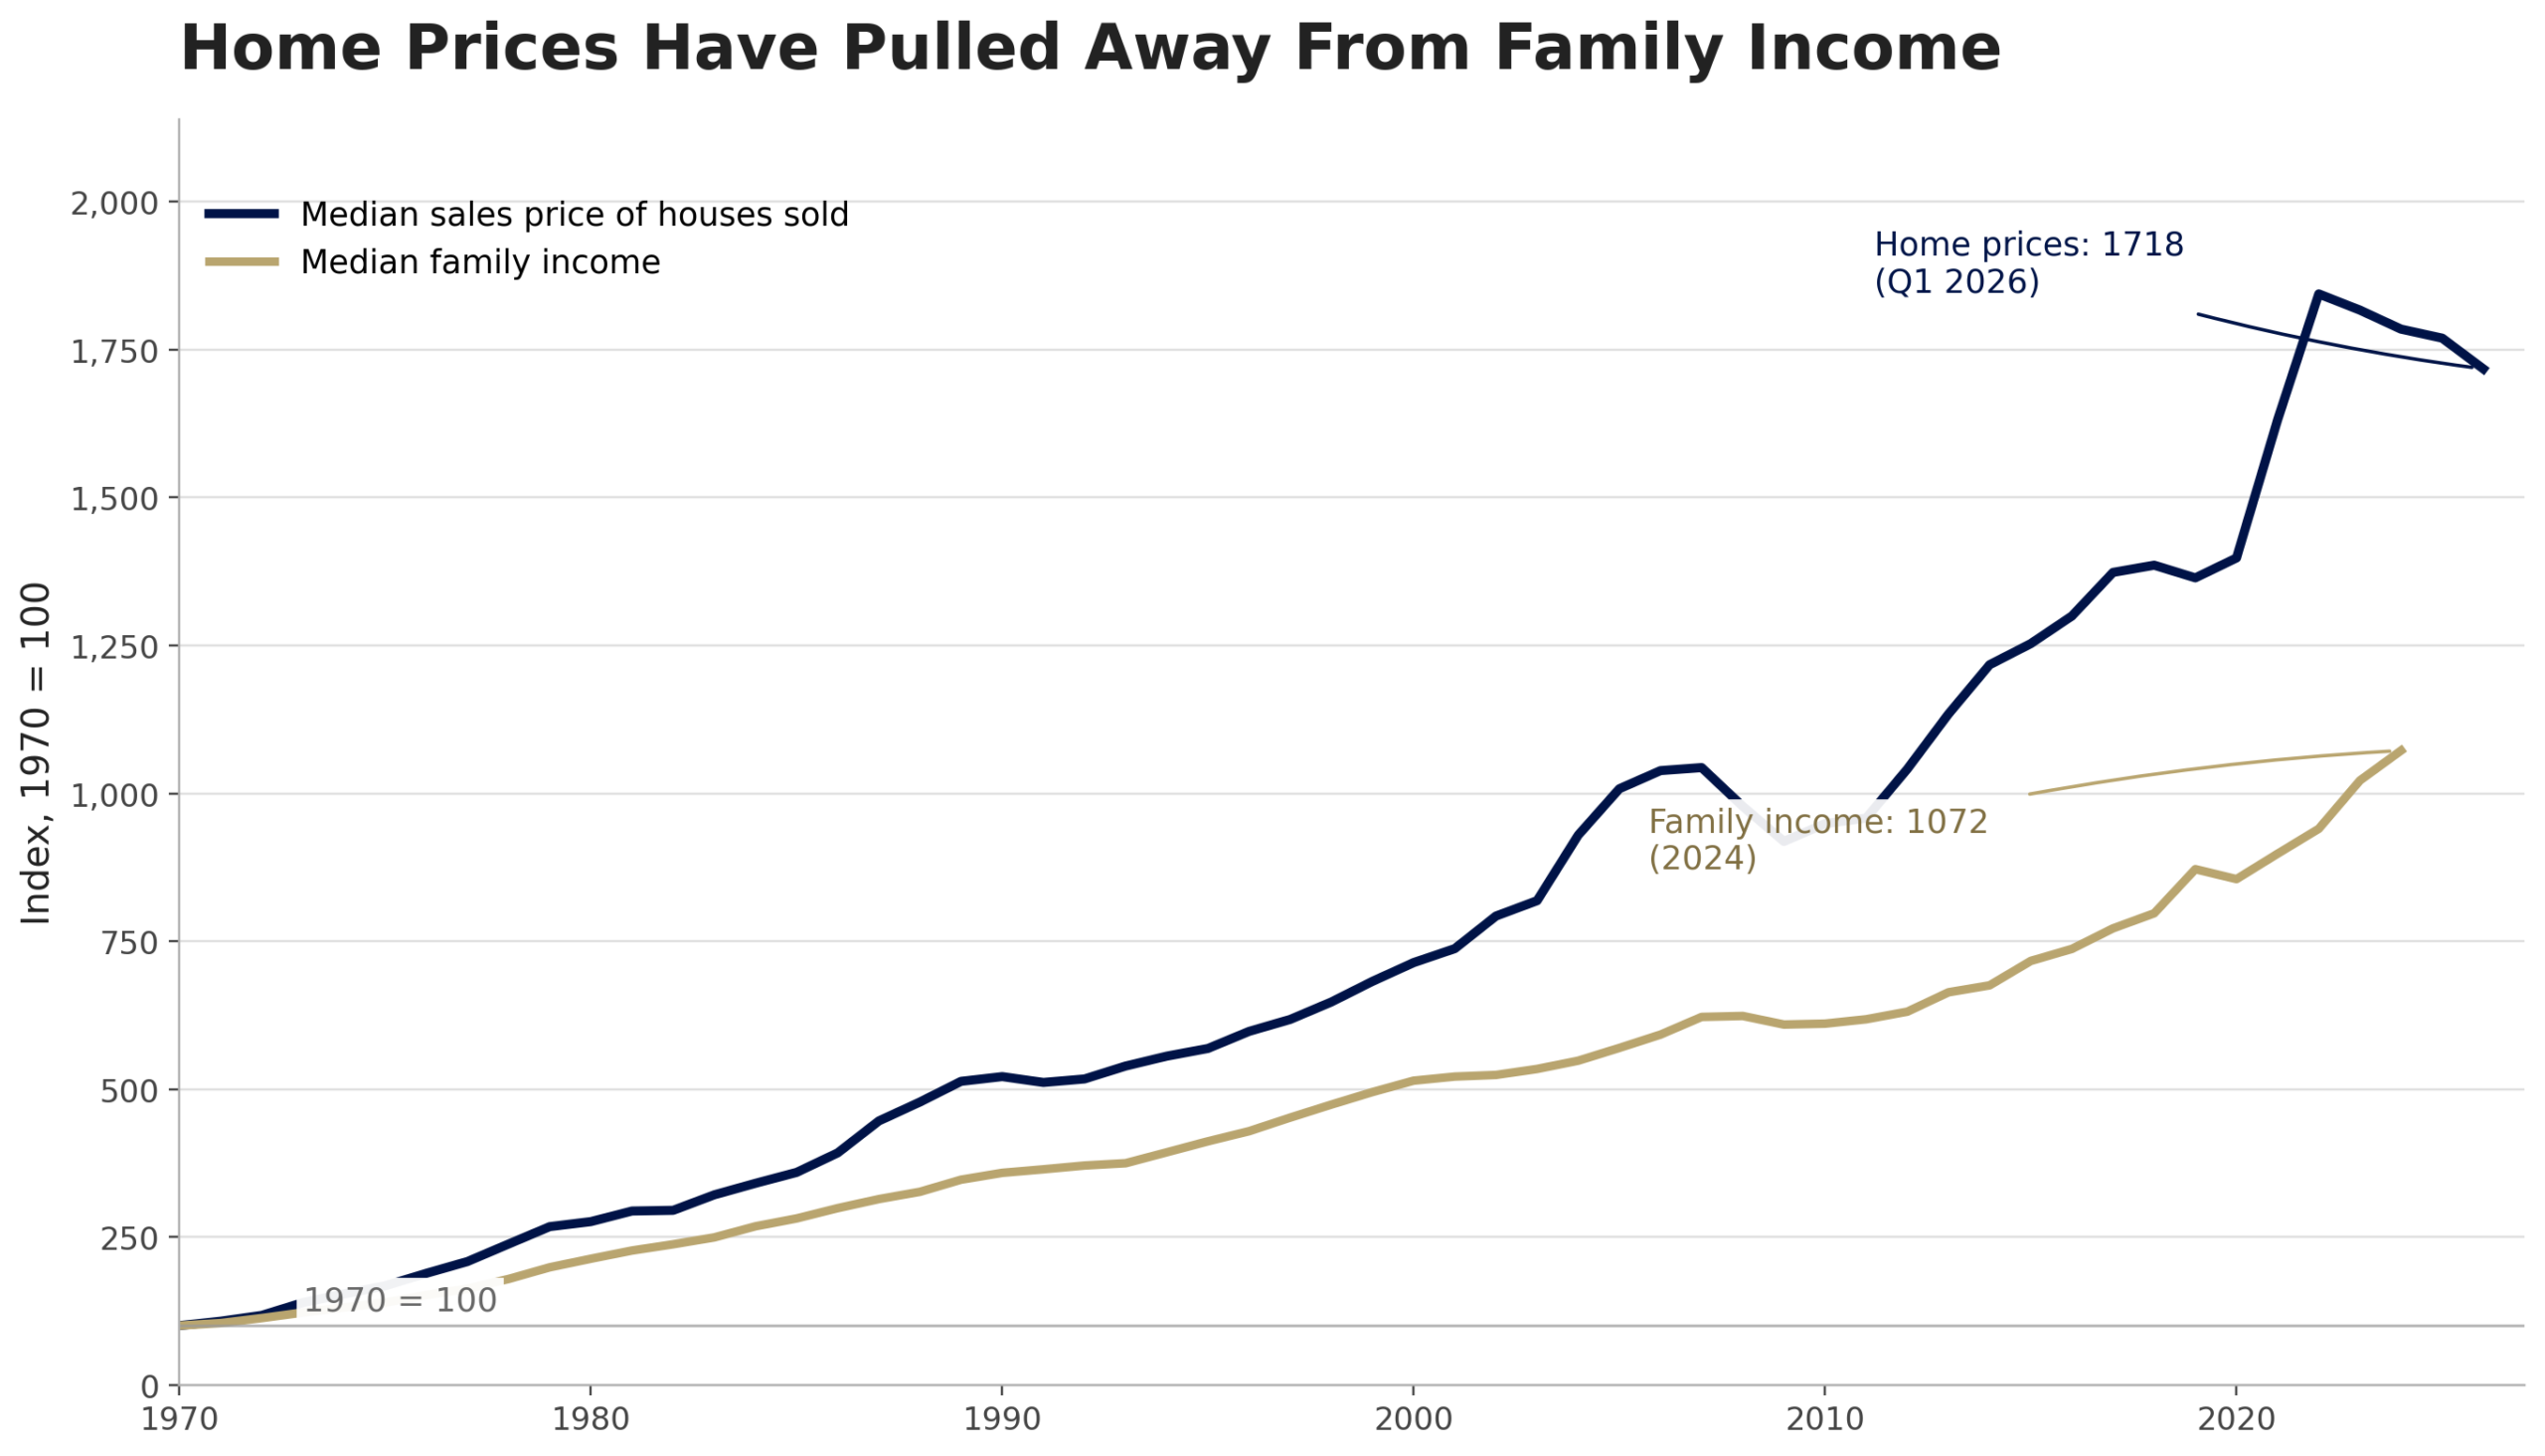
Home prices and family incomes both rose over the past half-century, but not at the same pace. Indexed to 1970, the widening gap shows why shelter now consumes far more of the household budget than it did for earlier generations. Source: U.S. Census Bureau/HUD via FRED, Median Sales Price of Houses Sold for the United States; U.S. Census Bureau via FRED, Median Family Income in the United States
The Fed’s annual household survey captures how widely that pressure has spread. Just above 9 in 10 adults said rising prices were a financial concern in 2025. 58% said year-over-year price changes had worsened their financial situation. Sixteen percent didn’t pay all their bills in the prior month. Only 63% said they could cover a hypothetical $400 emergency using cash, savings, or a credit card paid off at the next statement, down from 68% in 2021. While none of these signal an outright national crisis, they’re signs of compression: income that technically grows but doesn’t stretch as far, and a margin for error that keeps getting thinner.
What makes today different from earlier affordability debates is where the pressure concentrates. It’s heaviest in categories that can’t be deferred, such as housing, care, insurance, and medical costs. These aren’t wants. They are the baseline costs of participating in everyday American life. They’ve been rising faster than wages for so long that the math no longer works for many families. The result is an economy that looks resilient in aggregate spending data but feels increasingly precarious in the monthly budgets of a large and growing share of households.
How Mortgage Math Priced Out a Generation
A CFPB analysis made the modern affordability problem clear. A typical household earning $69,000 in 2019 could buy the median home and spend about 26% of its monthly income on principal and interest. By September 2024, with prices and rates both elevated, that household needed to spend roughly 36% of its monthly income for the equivalent payment. To keep the mortgage burden near 25%, it would have needed an income of approximately $119,000. The home didn’t change.
Freddie Mac put the average 30-year fixed mortgage rate at 6.52% in June 2026. The CFPB estimated that the monthly principal-and-interest payment on a $400,000 loan was still roughly $838 higher in September 2024 than at the January 2021 rate trough. That’s roughly equal to a car payment wiped out before a household gets to groceries.
The rate and supply problems reinforce each other stubbornly, something the CFPB calls a “lock-in effect.” Nearly 60% of active mortgages carry rates below 4%, and holders have little reason to sell. Fewer homes come to market. Prices hold. The entry cost for anyone buying now stays high regardless of what’s happened to headline affordability indices. More than one-fifth of active mortgages carry rates at or above 5%, creating two very different housing economies. Existing owners can look relatively stable, while new buyers face a different set of monthly costs within the same neighborhood, often the same zip code.
The National Association of Realtors (NAR) reported in May 2026 that its Housing Affordability Index improved to 105.6, up from 97.5 a year earlier. A reading above 100 indicates that the typical family earns more than the minimum required to qualify for a median-priced home mortgage. But qualification isn’t comfort. An affordability index doesn’t include today’s homeowners’ insurance bills, rising property tax assessments, or the financial fragility that comes from borrowing right to the edge of underwriting limits. Affordability can improve from terrible to merely hard and still leave households feeling poorer.
The Housing Shortage That Won’t Fix Itself
The structural problem runs deeper than recent rate cycles. A Treasury analysis found that more than 90% of Americans live in counties where rents and house prices outpaced incomes between 2000 and 2020. Inflation-adjusted rents rose more than 20% above their 2000 level over that span. Inflation-adjusted single-family house prices rose about 65%. Inflation-adjusted median household income barely moved. When the largest line item in the family budget grows steadily faster than income, every other category has to compress, or debt has to expand, or both.
The Treasury pointed to demographics as much as construction. Housing demand grew about 26% over those two decades, the housing stock grew about 19%, and the population grew about 17%. The gap wasn’t dramatic, but it was relentless. The share of Americans 55 and older climbed from 20% to 30% between 2000 and 2020. Older Americans are more likely to head their own households. More people wanting to live separately, not a population boom, drove the scarcity.
The Treasury concluded that Americans in low-income households are “on the brink of being priced out of a basic human need.” It added that “there will not be a quick fix to the long-term rise in housing costs.” Local zoning restrictions, land-use barriers, and geographic constraints don’t resolve on a quarterly schedule. A monthly inflation print can cool in weeks. A structural housing shortage often takes years.
Half of all renters are already beyond affordability by any conventional definition. Harvard’s Joint Center for Housing Studies reported in 2026 that 22.7 million renter households were cost-burdened in 2024, spending more than 30% of their income on housing. That was 49% of all renters, a record high. Another 12.1 million were severely cost-burdened, spending more than half their income on housing. The Fed’s SHED found that 23% of renters had been behind on rent at some point in the prior year, up 6 percentage points since 2021.
When nearly one in four renters has fallen behind, it’s a sign that purchasing power hasn’t just softened. It’s been reassigned to landlords and housing-related fixed costs, leaving less available for everything else, including the savings that would absorb the next shock.
Credit Cards Are Now the Budget Safety Net
When housing, food, transportation, insurance, and childcare all run ahead of income, households don’t stop being households. They patch. They delay. They lean on revolving credit.
New York Fed data put total household debt at $18.8 trillion as of March 2026. The Fed’s consumer credit release for April 2026 showed revolving credit at $1.35 trillion, growing at a 10.4% annualized rate. Some of that reflects higher nominal incomes and loyalty-card migration. But taken alongside the Fed’s household survey data, showing thinner emergency buffers and more frequent bill shortfalls, the pattern is clear. Credit has become the household shock absorber.
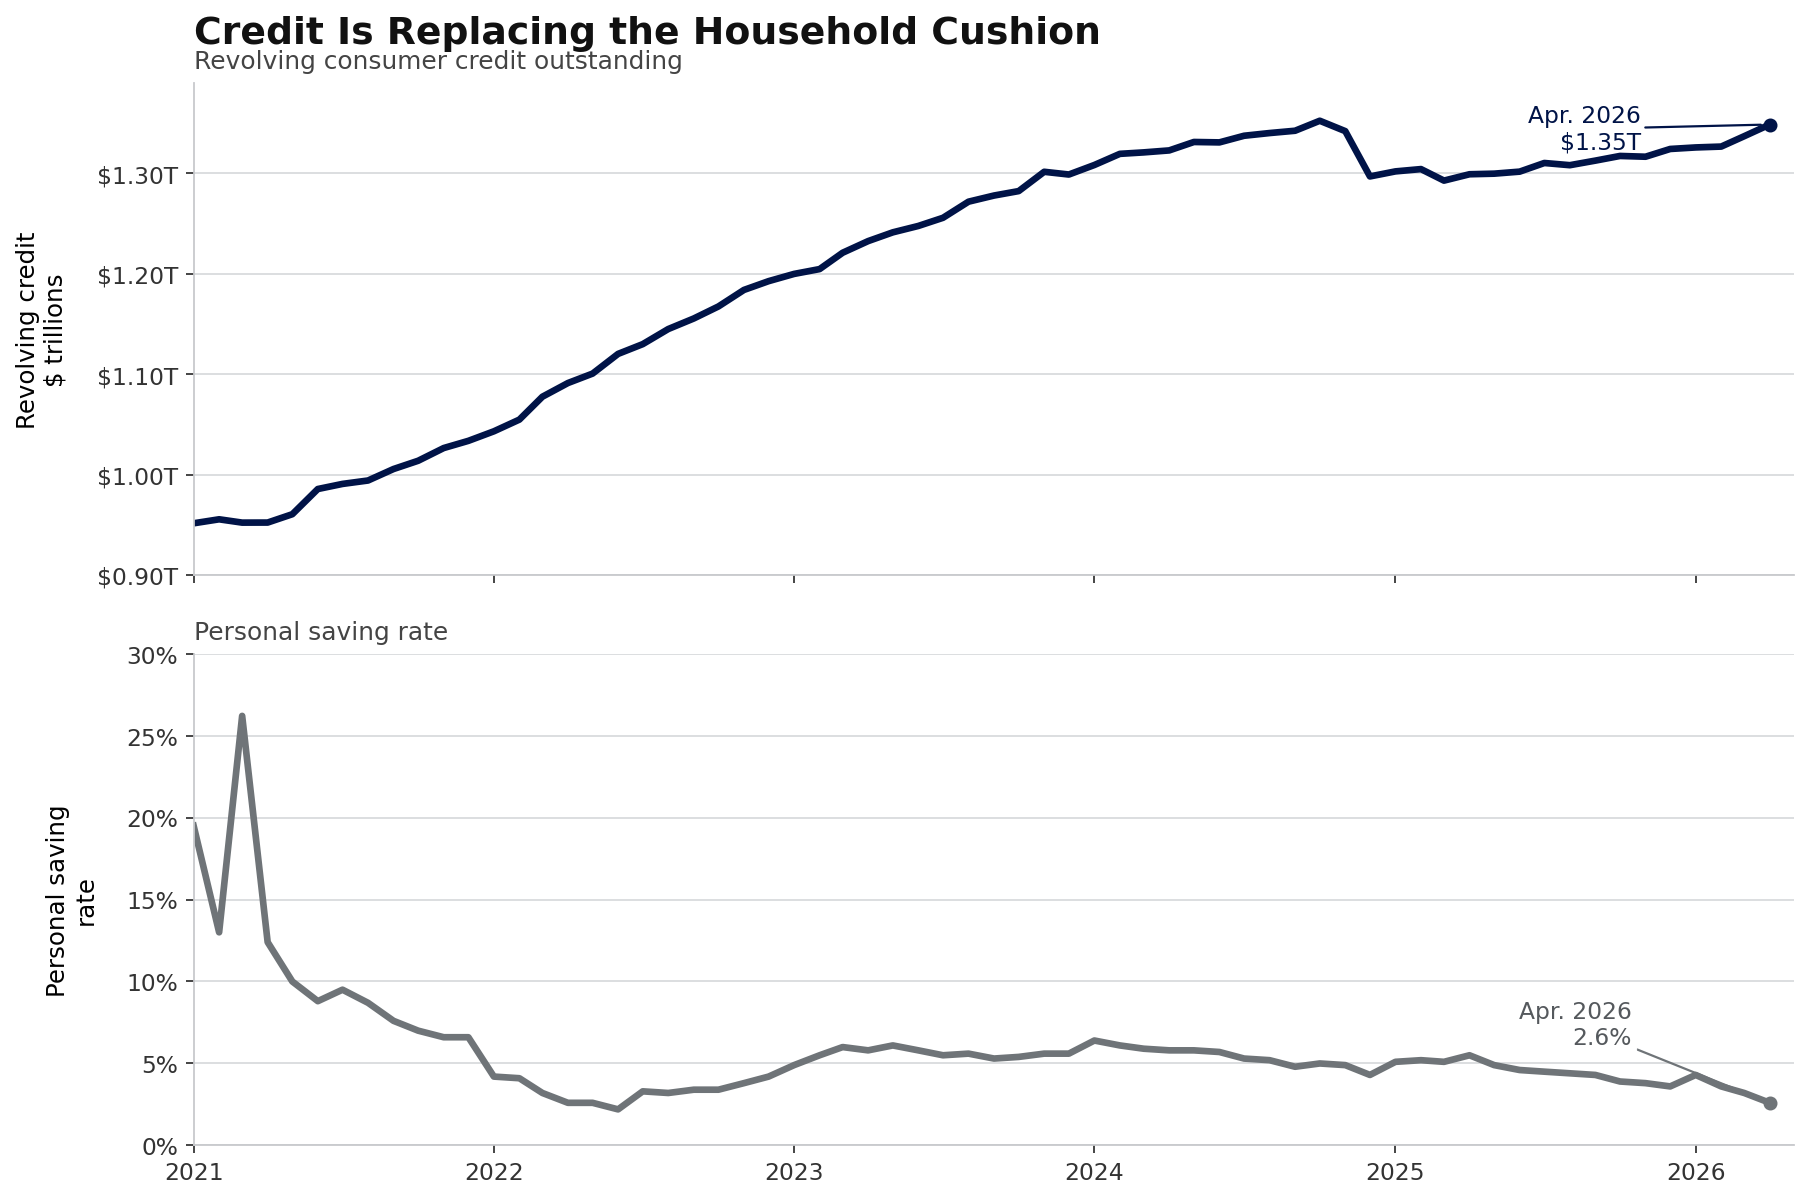
As household savings thinned, revolving credit kept climbing. That combination helps explain why many families can still spend, but increasingly do so by borrowing against future income, Source: Federal Reserve, Consumer Credit; Bureau of Economic Analysis, Personal Saving Rate.
And it’s an expensive one. The same release showed that in the first quarter of 2026, commercial bank credit card plans averaged 21% overall and 21.52% on accounts assessed interest. Personal loans averaged 11.40%. A 60-month new-car loan at a commercial bank averaged 7.52%. A household covering a grocery shortfall or an emergency repair with a credit card isn’t just borrowing. It’s buying back its own purchasing power at 20%-plus annual interest, a cost that compounds month after month without resolution.
The CFPB’s consumer credit report found that 49% of cardholders revolved a balance in 2024, while a separate Making Ends Meet report added that 23% of cardholders paid a late fee during the year. The Fed’s SHED adds another angle. Since 2023, average credit card balances have increased by more than 35% among adults who reported “finding it difficult to get by.” Among all adults, 59% had at least one major unexpected expense in the prior year. Only 55% of adults report having 3 months of emergency savings, according to the SHED emergency-savings table. Most surprise bills land on revolving credit or skipped payments.
The saving rate confirms the direction. BEA data shows households are saving just 2.6% of disposable income, a level that offers almost no runway when an unexpected bill arrives.
Another 47% of adults ages 18 to 29 received financial help from outside their household in the prior year. These informal transfers don’t show up in delinquency data. But they absorb capacity across families and shift financial stress across generations. One reason purchasing power feels so much weaker than aggregate income data suggest is that many households no longer stand on their own earnings. They stand on extended support networks. Parents covering rent, grandparents helping with child care, relatives paying emergency bills, and family members filling the gaps that wages no longer cover.
Price Levels, Not Inflation Rates, Are the Real Issue
Inflation may have cooled from its 2022 peak, but the distinction between a rate and a level doesn’t get enough attention in public discussions of household finances.
The BEA reported headline PCE inflation at 3.8% in April 2026 and core PCE at 3.3%. Both remain above the Federal Reserve’s 2% target, which former Chair Jerome Powell reiterated in his April 2025 economic outlook remarks. The BLS May 2026 CPI release showed shelter prices up 3.4% year over year. Slower inflation helps. It doesn’t reverse the earlier jump.
In an earlier statement, Powell said high inflation “takes a toll on families,” especially those with less ability to absorb higher food, housing, and transportation costs. That surge has partly subsided. The higher price level it created hasn’t. Households aren’t recovering to their previous levels. They’re trying to build stability on a foundation that was permanently raised.
BLS data for May 2026 showed real average hourly earnings falling 0.8% from May 2025 to May 2026. Nominal hourly earnings rose 3.4% over that same period. Workers aren’t standing still. The treadmill is also moving. It runs fastest in the categories that matter most to household stability: shelter, debt service, and care.
The Hidden Costs Behind the Official Inflation Data
Some of the sharpest pressure comes from costs that CPI doesn’t fully capture, or from categories that have risen far faster than the headline average.
A CBO analysis found that adjusted income, after transfers and taxes, roughly kept pace with price growth for the middle quintile between 2019 and 2023. A near-wash in the aggregate. But that wash hides the distribution. Lower-income households saw faster price growth in their typical spending baskets, largely because food and energy accounted for a larger share of their budgets. A family can delay a furniture purchase, but it can’t delay rent, utility bills, or feeding its children. When those categories rise faster than average, purchasing power shrinks where it hurts most.
Childcare is among the most consequential costs outside the standard debate. Labor Department data show that full-day care for one child absorbed between 8.9% and 16.0% of median family income in 2022. Annual prices ranged from $6,552 to $15,600. Among families paying for both childcare and housing, the Fed’s SHED found that most spent at least 50% more on childcare than on housing. Two of the highest modern costs have grown heavy enough that one income often can’t support the whole structure.
Insurance inflation is adding a different kind of burden, this time for homeowners. The SHED found that 14% of insured homeowners struggled to afford their premiums. Another 20% couldn’t buy as much coverage as they wanted, and 6% went without homeowners’ insurance, mostly because of cost. A paid-off house remains valuable, but rising insurance, maintenance, and property tax burdens mean that even outright owners don’t enjoy the budget predictability homeownership once implied.
The SHED also found that 26% of adults skipped medical care because of cost in the prior year. These aren’t luxury purchases. They’re the price of ordinary participation in American life, and deferred medical costs tend to surface later as larger ones.
What Delayed Milestones Really Cost
One of the clearest expressions of compressed purchasing power is delayed independence. The Fed’s SHED found that 49% of adults under 30 lived with a parent in 2025, up 6 percentage points from 2022 and 12 points from 2019. Treasury’s housing data found that the share of Americans ages 25 to 34 heading their own households fell from about 50% in 1980 to around 40% in 2020. Many don’t stay at home by preference. They’re responding to an economy where the first rung of independent adulthood costs more relative to income than it has in decades.
The retirement picture follows the same logic. Only 35% of non-retirees believed their retirement savings were on track in 2025, according to the Fed’s SHED. The personal saving rate stood at 2.6% in April 2026. When present-tense costs consume what would have become long-term savings, the economy converts future resilience into current coping. The aggregate measures hold for a while. The capacity underneath erodes.
The burden doesn’t fall evenly. The Treasury found that in 2022, 57% of Black renter households and 54% of Hispanic renter households spent more than 30% of their income on housing. For White renter households, the share was 45%. The SHED found that only 40% of Black adults and 46% of Hispanic adults could cover a $400 emergency with cash, against 73% of White adults. Shrinking purchasing power isn’t a single national experience. It moves through stratified exposure to rent burdens, inherited wealth, and access to lower-cost credit.
The aggregate measures stay relatively stable partly because many homeowners locked in mortgages at rates below 4% years ago. The Fed’s household debt service data put total household debt service at 11.32% of disposable personal income in the fourth quarter of 2025, below pre-pandemic levels. The Fed’s commercial-bank credit card delinquency series showed a 2.92% rate in the first quarter of 2026, modestly below the prior quarter. Stable aggregates and mounting pressure aren’t mutually exclusive, though. A Fed Board analysis of delinquency trends found that most of the post-pandemic rise came from higher balances and more credit extended to riskier borrowers. Unemployment was a secondary factor. Household stress doesn’t have to wait for a recession to build. It can accumulate simply because balances grow, and the cost of carrying them stays high.
Where the Squeeze Goes From Here
The outlook is particularly concerning because it doesn’t point to a single cause or a quick resolution. What makes this moment unusual is the simultaneous combination of pressures. Housing costs are elevated by both price and rate. Inflation is still above the target. Saving near historic lows. Revolving credit is growing faster than income. Child and elder care is consuming a rising share of family budgets. Insurance costs are eroding homeowner stability. None of these would break the back of a typical household budget. Together, and running for long enough, they’ve made the margin thinner than the headline data suggest.
Real wages are declining year over year. Saving has compressed toward historic lows. Revolving credit is growing faster than income. Housing entry costs remain elevated at both purchase and rental levels. The costs that affect daily financial stability most directly, shelter, care, insurance, and medical expenses, tend to run faster than the headline averages often cite. The economy can sustain this for a time because aggregate spending remains decent and labor markets are still functioning. But that resilience depends on households continuing to absorb shocks with very little capacity to absorb them. If unemployment weakens, today’s stability could prove borrowed.
The question that now matters for a growing share of American households isn’t whether wages are up or whether inflation has cooled from its 2022 peak. It’s whether ordinary work can still pay for an ordinary life without growing dependence on debt and informal family transfers. Can a household cover housing, food, transportation, care, insurance, and a modest emergency reserve out of current income? Or does the gap always require bridging?
When that answer becomes unclear for long enough, the logic of financial resilience shifts. Assets that don’t depend on continued policy credibility or the health of the credit cycle become more relevant, and that shift is already visible at the sovereign level. The World Gold Council’s 2025 central bank demand report found that central banks bought 863.3 tonnes of gold.
That’s historically high, even as it slowed from prior years. Reserve managers, the World Gold Council notes on its official reserves page, value gold for its “safety, liquidity, and return characteristics.” Those properties resonate differently when the purchasing power of paper claims is at issue. For households thinking beyond immediate cash flow, the same logic applies in different proportions. Diversification into assets less dependent on policy stability has historically made more sense when purchasing power is the variable in doubt.
The American middle-class bargain has grown less forgiving. One paycheck buys less shelter, less cushion against shocks, and less freedom from finance charges. The national accounts seem stable. But the household ledger reads tighter, and the gap between the two keeps widening.