By Preserve Gold Research
Just over a decade ago, Americans were left stunned when the housing market bubble suddenly burst, shattering the illusion of a never-ending boom. Memories of the 2008 financial crisis still linger in the minds of many, etched in the scars of lost homes and savings. A time when the economy came to a screeching halt and millions of Americans were left jobless and struggling to make ends meet. A time when central banks around the world were sent scrambling to find ways to stabilize their economies. But what may not be as widely remembered is how quickly an imbalanced economy can unravel when warning signs are ignored.
Experts have noted eerie parallels between today’s market environment and the pre-2008 housing crisis, where cheap debt and market bubbles fueled a false sense of prosperity. In the years leading up to 2008, easy access to credit allowed people with lower incomes and poor credit histories to obtain mortgages they couldn’t afford. This created a surge in housing prices, leading to speculation and, eventually, a bubble that burst with devastating consequences.
Fast forward to today, and we see similar patterns emerging—rising consumer and corporate debt levels, soaring stock prices, and a growing disconnect between the economy and the stock market. Apart from the emergency rate cuts during the COVID-19 pandemic, the last half-point rate cut occurred right before the 2008 crisis. With the Fed’s recent announcement of a 50 basis point rate cut, experts are sounding the alarm on a potential repeat of the pre-2008 market trends. But is history repeating itself? Are we heading towards another market crash like the one in 2008? A closer look at current market trends and underlying economic factors helps shed some light on the situation.
Market Bubbles: Cheap Debt Then and Now
In 2007, as the housing bubble began to burst, the Federal Reserve made a drastic pivot from rate hikes to rapid rate cuts. The early 2000s had seen a steady climb in interest rates, but as signs of trouble surfaced in the housing market, the Fed slashed rates in an attempt to stave off a collapse.
“The substantial easing of monetary policy to date, combined with ongoing measures to foster market liquidity, should help to promote moderate growth over time and to mitigate risks to economic activity,” the Fed said in a statement at the time. But the shift came too late. By then, cheap credit and lax lending standards had already inflated the housing market to unsustainable levels. Mortgages were being handed out like candy, with little regard for borrowers’ ability to repay. The inevitable happened—defaults soared, and the bubble burst, causing a domino effect that spread to the rest of the economy.
So why is cheap debt such a dangerous game? The answer lies in the concept of leverage—the use of borrowed money to increase potential gains. When markets are stable, and assets are appreciating, leverage can be a powerful tool for generating returns. But when markets turn sour, the impact of leverage can be catastrophic. In 2008, the housing market collapse triggered a chain reaction of defaults and foreclosures. Highly leveraged financial institutions that had invested heavily in mortgage-backed securities were unable to cover their losses, leading to widespread panic and a credit crunch. The stock market soon followed, plunging to its lowest levels in years despite the Fed’s efforts to pump liquidity into the system.
The parallels to today are as clear as they are unsettling. Over a decade of record-low interest rates and loose monetary policy resulted in a surge of borrowing, both for consumers and corporations, between 2009 and 2021. Cheap debt fueled stock buybacks and M&A activity, pushing stock prices to record highs and creating an illusion of economic growth in the process. To this day, outstanding corporate debt continues to set new all-time highs with no signs of slowing down. And real estate prices have reached dizzying heights, with some cities experiencing double-digit, year-over-year price increases.
Despite the lessons learned from the 2008 financial crisis, the lure of cheap debt has led many to repeat the same mistakes—only this time, on an even larger scale. With a multi-asset bubble ready to burst and a growing debt burden, the Fed’s recent decision to slash interest rates could add fuel to the fire. Viewing today’s economy through the lens of historical trends, experts say that the current situation is unsustainable, and a correction is long overdue. Whether it will be a gradual decline or a sudden crash remains to be seen, but experts say a confluence of factors suggests that we are approaching a tipping point.
Parallels Between Economic Indicators: 2007 vs. 2024
In 2007, the Fed cut rates from 5.25% to 4.75% in September and then to 4.25% in October. Today, we’re witnessing a similar trend, with the Fed reversing its tightening policy in September amid signs of an economic slowdown. Why is this concerning? Because it suggests that the Fed could be prioritizing short-term economic growth over long-term stability. The same approach was taken in 2007, right before the housing bubble burst, stock markets tumbled, and unemployment skyrocketed.
Unemployment Rising, Job Growth Slowing
Looking at other key economic indicators, we can see additional parallels between the past and present. In July 2007, non-farm payrolls saw a meager increase of 92,000 jobs, a sharp decline from the previous 12-month average of 126,000. Unemployment remained steady at 4.6%, up slightly from a low of 4.4%. And construction and manufacturing sectors began showing signs of distress, with the subprime mortgage crisis casting a dark shadow.
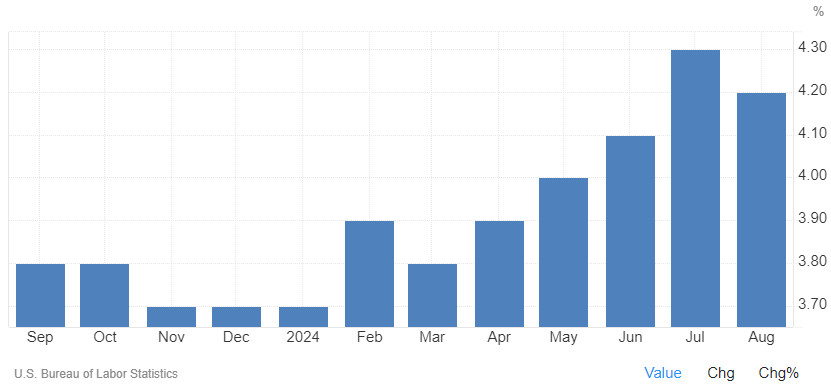
Fig. 1 United States Unemployment Rates (2023-2024) | Trading Economics
Fast forward to July 2024, and the picture isn’t much rosier. Non-farm payrolls added only 114,000 jobs, falling short of the expected 179,000. Compounding the concern, downward revisions continue to plague previous months’ job growth numbers, masking the economy’s true health. Unemployment, while still relatively low at 4.2%, has been steadily ticking up since the beginning of the year. And Sahm’s Rule, a recession indicator based on the three-month unemployment average, was activated in July, suggesting that a downturn is emerging.
Manufacturing Sector Under Pressure
Meanwhile, the manufacturing and construction sectors are showing signs of weakness, with experts pointing to declining business investment and high borrowing costs as contributing factors. “Demand remains subdued, as companies showed an unwillingness to invest in capital and inventory due to federal monetary policy — which the U.S. Federal Reserve addressed by the time of this report — and election uncertainty,” said Tim Fiore, chair of the Institute for Supply Management’s (ISM) Manufacturing Business Survey Committee. The latest Manufacturing ISM Report On Business also revealed that the manufacturing sector experienced a contraction in September for the sixth consecutive month. This marks the 22nd instance of contraction in the past 23 months, with the only exception being in March 2024.
Before the thick of the subprime mortgage crisis in 2008, the manufacturing PMI (Purchasing Managers’ Index) slid into contraction territory and eventually receded to a low of 38.9%. While the current PMI has not yet reached those lows, the downward trend is concerning as it reflects a sustained decrease in business activity and new orders. Despite the Fed’s pivot to a more accommodative monetary policy as of September, long and variable lags in monetary policy mean the effects may take some time to be felt. “The fourth quarter is slower than anticipated. We won’t realize the effect of interest rate adjustments with new project starts until the first quarter of 2025,” noted one survey respondent in the ISM report. With weakness in the manufacturing sector often a harbinger of a broader economic slowdown, the latest PMI reading of 47.2% has sparked concerns about the possibility of another recession.
Rising Loan Delinquency Rates
According to experts, the specter of rising loan delinquency rates adds another layer of concern to the economic outlook. In the fourth quarter of 2007, credit card delinquency rates crept up to 4.68% from 3.62% two years earlier. Today, delinquency rates are following a similar trajectory, with rates rising from 1.48% in the second quarter of 2021 to 3.2% in the second quarter of 2024. Though still below the pre-crisis peak, these numbers suggest that more and more consumers are struggling to make their loan payments on time. With credit card debt reaching record highs and consumers taking on more debt overall, the potential for delinquency rates to exceed previous highs isn’t out of the question.
Commercial real estate loan defaults have painted a similar foreboding picture. Between Q3 2022 and Q2 2024, the rate jumped from below 1% to 2.01%, mirroring the prelude to the 2008 crash when it soared from 0.98% to 2.75%. Although 2024’s rates aren’t as dire as 2007’s, the parallels are still concerning, especially as loan defaults trickle down to financial institutions and threaten the banking sector’s stability.
Gold Prices: A Barometer of Market Uncertainty
While economic indicators such as the PMI and loan delinquency rates can provide insight into the state of the economy, some analysts believe that the price of gold can also serve as a reliable barometer. Often seen as a safe haven during times of uncertainty, Americans flocked to gold during the 2008 financial crisis, driving prices up to record highs. In a matter of months, the price of gold climbed by 15%, reaching around $1,200 per ounce in late 2007.
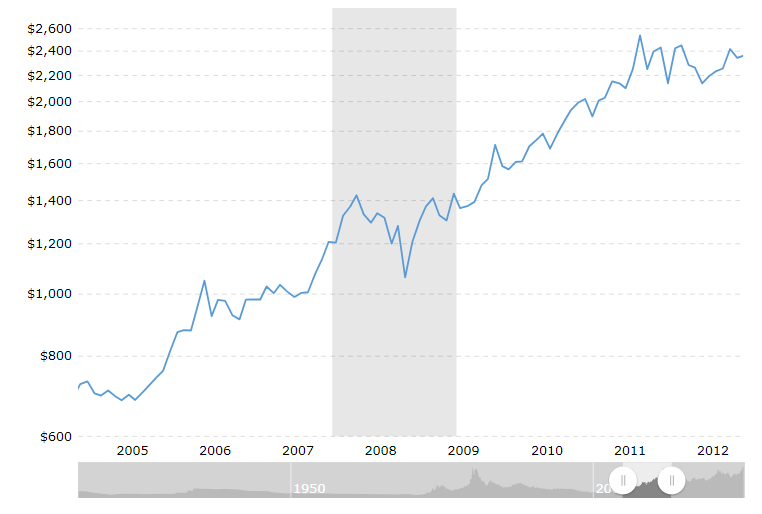
Fig. 2 Historical Prices of Gold | Macro Trends
With the economy facing similar headwinds in 2024, gold prices have once again surged, surpassing the $2,600 in September. This may not indicate much by itself, but combined with other indicators, it paints a picture of growing unease among investors.
Irrational Exuberance: A Warning Sign
While high consumer and commercial debt levels may seem alarming, they can be justified if the economy is performing well. However, concerning current affairs, these worrying indicators coincide with record highs in stock market indices. In 2007, the S&P 500 hit its peak before plummeting during the 2008 crisis, and it appears to be on a similar trajectory in 2024. This year, the S&P 500 has reached all-time highs, gaining over 20% since the start of the year, despite the economy’s headwinds.
This juxtaposition between struggling economic indicators and soaring market indices has raised concerns of irrational exuberance, a term coined by former Federal Reserve Chairman Alan Greenspan to describe the euphoria and overvaluing of assets during times of economic instability. With a surge of new investors entering the market and a wave of speculative activity, the parallels between the current state of the economy and the conditions leading up to the 2008 crisis are hard to ignore.
Pressure Mounting for the Fed
The reversal of the Fed’s restrictive monetary policy surprised many who expected rates to remain steady until inflation reached the central bank’s target level of 2%. And with core inflation still above 3%, the Fed’s decision to lower rates has sparked concerns that the central bank is bowing to political pressure and risking long-term economic stability. Lower interest rates can lead to increased borrowing and spending, which may provide a short-term boost to economic growth but could also fuel inflation and the multi-asset bubble we’re currently witnessing. That is, of course, assuming that the mountain of consumer and corporate debt doesn’t come crashing down first under the weight of higher rates.
September’s rate cut marked the first reduction since the pandemic days, following a lengthy period of aggressive rate hikes intended to combat inflation. Fed Chair Jerome Powell emphasized the importance of this decision, stating, “We’re trying to achieve a situation where we restore price stability without the kind of painful increase in unemployment. This action shows our strong commitment to that goal.” However, this move also mirrored past attempts to control runaway inflation—attempts that, once before, fell short of their intended outcomes.
The Fed’s unenvious task of balancing inflation without stunting economic growth has always been challenging. But the current state of affairs is particularly difficult, as the Fed faces immense pressure from all sides. Cracks in the economy, such as weakening business sentiment and rising unemployment rates, have been evident for months. At the same time, inflation continues to weigh on the minds of millions of Americans as they struggle to keep up with rising prices. To top it off, the looming threat of a potential debt crisis adds another layer of complexity to the Fed’s decision-making.
Will History Repeat Itself?
The 2008 crisis taught us the dangers of complacency and the consequences of ignoring warning signs. In the years leading up to the crisis, experts pointed to the rapid growth of subprime mortgages and the increasing levels of household debt as red flags. Yet, these warnings were largely ignored until it was too late.
Will the lessons of the past serve as a guide for the Fed’s current actions, or is it too late? While history may not repeat verbatim, it often rhymes, and the parallels between the current situation and the events leading up to the 2008 crisis are hard to ignore. The Fed’s recent tapering announcement may provide temporary relief, but with inflation still far above the target and a potential debt crisis on the horizon, it remains to be seen if this is enough to prevent another economic downturn.