
By Preserve Gold Research
The U.S. economy surged in the third quarter, at least according to the statistic that still commands the most deference. Gross domestic product advanced at a pace that, on paper, signals momentum, resilience, and even renewed strength. According to the U.S. Commerce Department, real GDP expanded at an annualized 4.3% rate in Q3 2025, far above expectations and the strongest quarterly growth in roughly two years.
Much of the media coverage has treated that figure as dispositive. Headlines have framed the result as proof that the economy is not merely growing, but accelerating. Yet the public response has been more skeptical. An Allianz Life poll reports that 48% are more stressed heading into 2026 than they were at the start of 2025. Measures of confidence tell a similar story. By December, the University of Michigan consumer sentiment index was nearly 30% below its level in December 2024. “Pocketbook issues continue to dominate consumer views of the economy,” the survey’s director noted. The distance between the headline numbers and lived experience is hard to miss.
That disconnect shows up in everyday life. Grocery bills are still high. Housing remains out of reach for many would-be buyers. Job security feels shakier with each monthly employment report. As Lawrence White, an economist at New York University, has put it, “Households don’t experience GDP. They experience prices, wages, and hours worked. Right now, all three feel out of sync with the official data.” The point isn’t rhetorical. It reflects a growing divergence between aggregate output and household conditions.
Labor market data sharpen the contrast. In November, unemployment ticked up to 4.6%, the highest level since 2021, while monthly job growth has averaged only about 50,000. Consumer sentiment has slipped to recession-like lows even as measured output has pushed higher. Many Americans report feeling worse off financially than a year earlier, despite the economy’s apparent momentum. In effect, GDP continues to rise while a large share of households is treading water or losing ground. The widening gap between “economic strength” on paper and economic strain on Main Street suggests that GDP, on its own, remains an incomplete and potentially misleading gauge of real prosperity.
A Metric Built for Production, Not Prosperity
To understand the illusion of economic strength, it helps to understand what GDP actually measures and what it was never designed to capture. Gross domestic product was built as an accounting tool, not a measure of happiness, security, or quality of life. Developed in the mid-20th century, it was designed to quantify the total value of goods and services produced within a country over a given period. In that narrow sense, it works well enough. Policymakers can see whether output is expanding or contracting. Economists can compare performance across countries or decades. Markets can benchmark expectations and price risk accordingly.
Problems arise when GDP is asked to do work it was never meant to do. Even its original architects understood its limits. Simon Kuznets, one of the economists most closely associated with the early development of GDP, explicitly warned that “The welfare of a nation can scarcely be inferred from a measure of national income.” Output could rise even as living standards stagnated or deteriorated. That caution, central to the metric’s origins, has mostly faded from popular understanding.
Modern GDP still follows the same core logic. If money changes hands for a good or service, it counts. If it doesn’t, it disappears from the ledger. Childcare provided by a parent has no economic value in GDP terms, while paid childcare does. A forest preserved adds nothing to output, but logging it does. Treating stress-related illness boosts GDP through medical spending, while the stress itself remains invisible. The metric captures transactions, not lived conditions.
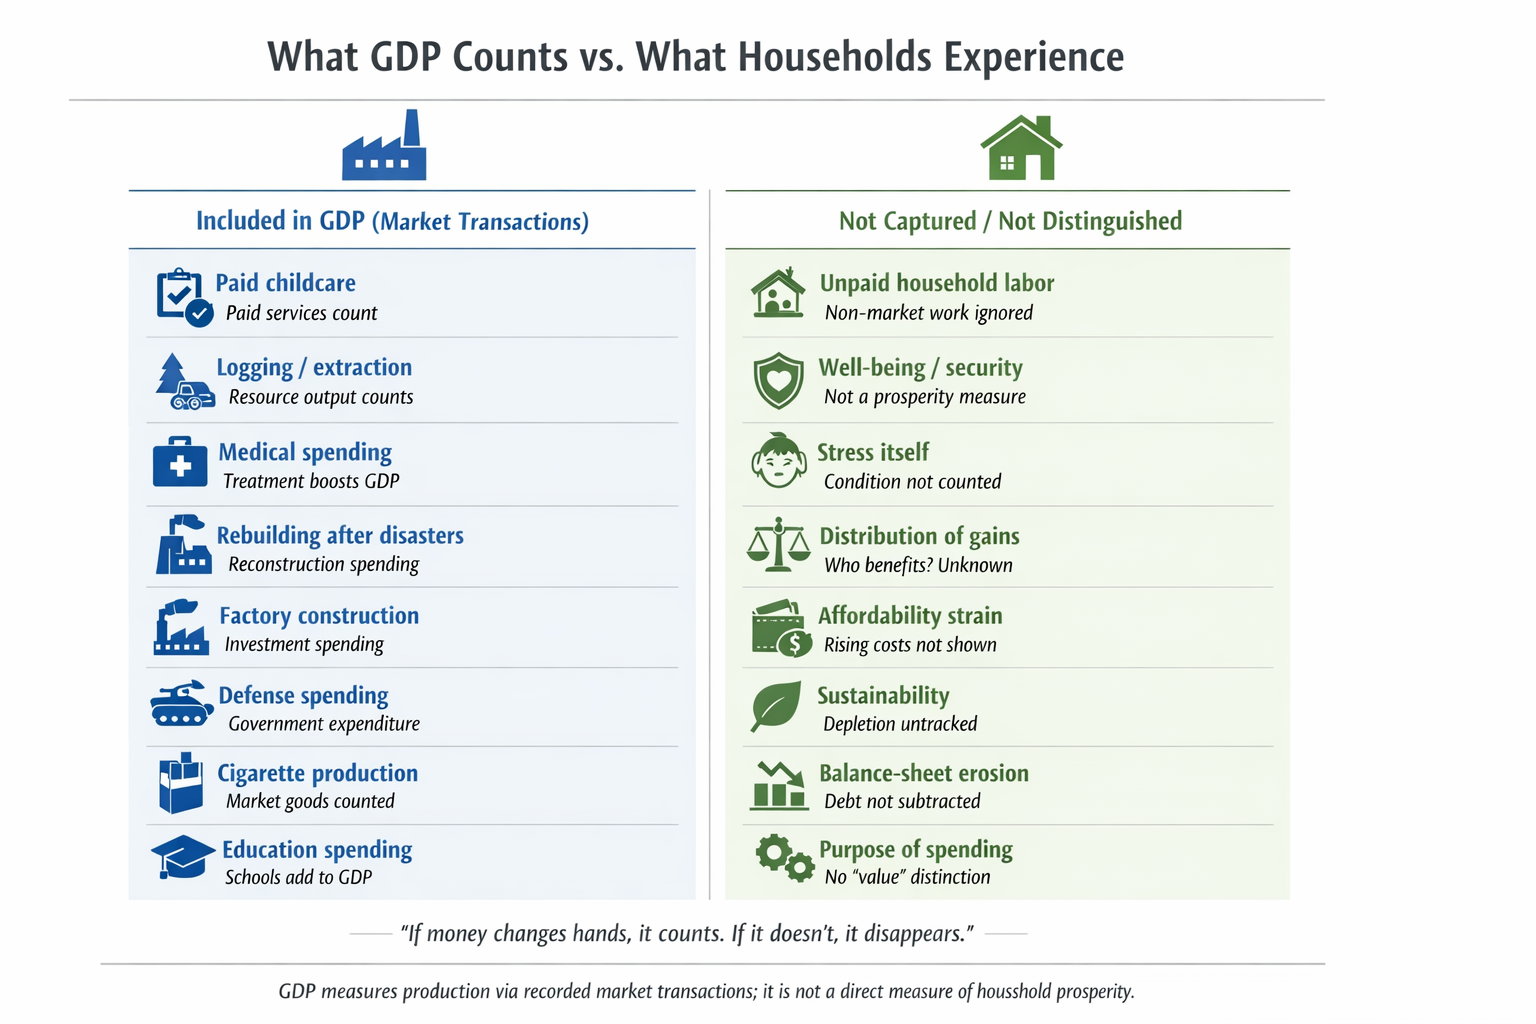
This neutrality extends to the composition of spending itself. Building a new factory raises GDP, but so does rebuilding after a natural disaster. Manufacturing life-saving medical equipment increases output, and so does producing cigarettes. In GDP’s accounting framework, all expenditures are treated as equivalent. There is no distinction between productive and unproductive activity, between investment that expands future capacity and spending that merely absorbs resources. A dollar spent on weapons or waste counts the same as a dollar spent on education or infrastructure.
The implications are not subtle. GDP can rise on the back of activity that does little to enhance human well-being, or that actively undermines it. By this logic, the production of weapons can appear more valuable than the distribution of mosquito nets in countries battling malaria. The metric measures volume, not purpose. It tracks output without asking whether that output improves lives.
GDP also ignores how the gains from growth are distributed. It says nothing about who benefits and who doesn’t. Output can surge even as household finances deteriorate. A country’s aggregate wealth can rise without ordinary people experiencing any improvement in their economic circumstances. That dynamic has been evident in recent years, with headline GDP reaching record levels even as median real incomes for many Americans stagnate or decline after accounting for higher living costs.
Equally absent is any measure of sustainability. GDP doesn’t register the erosion of household balance sheets through dwindling savings or mounting debt. It does not account for environmental depletion, long-term health outcomes, or the durability of public finances. Growth financed by leverage, resource exhaustion, or deferred costs looks identical to growth built on durable investment and rising productivity.
The institutions that compile the data are careful about these limits. Agencies such as the Bureau of Economic Analysis describe GDP as a measure of production. Outside technical circles, however, that nuance often disappears. GDP growth is routinely treated as synonymous with national progress, even though the metric itself makes no such claim.
As the structure of the economy has shifted, this gap has widened. Services, finance, and intangible assets now dominate measured output, while household stability, affordability, and economic security have grown harder to maintain. GDP faithfully records the expansion of the former and remains largely silent on the erosion of the latter. It measures the size of the economy with precision. But it offers far less insight into how well that economy serves the people living within it.
How Inflation and Debt Inflate GDP Growth
One reason headline GDP so often sends misleading signals is that inflation mechanically inflates nominal output. When prices rise across the board, the dollar value of goods and services sold increases even if households are not buying more in real terms. As long as inflation remains positive, nominal GDP is, by definition, inflated by rising prices. In the inflationary environment of 2025, that distinction has mattered enormously. Data from the U.S. Commerce Department show nominal GDP expanding by about 8.2% year over year, while real private demand rose only about 3% after inflation was stripped out. Higher prices, not higher volumes, explained much of the apparent growth.
The mechanics show up clearly in household spending. Consumer outlays increased in part because families paid more for essentials such as food, housing, and utilities, not simply because they consumed more. The GDP deflator climbed 3.4% in Q3 2025, its fastest increase since early 2023. That meant a meaningful share of the reported 4.3% GDP gain reflected higher prices rather than additional output. Inflation created the appearance of momentum at the macro level while steadily wearing down purchasing power at the household level.
Debt has compounded this distortion. Borrowing-fueled spending and ongoing fiscal deficits can lift GDP in the short run by pulling demand forward. In 2025, strong consumption was supported in part by households drawing down savings and leaning more heavily on credit, with the national saving rate in Q3 falling back toward levels last seen in late 2022. Federal spending, particularly on defense, also provided a boost to output. These forces prop up GDP today, but they do so by shifting costs into the future.
In the historical context, the imbalance is hard to miss. The United States entered this period with unusually large fiscal deficits despite peacetime conditions and low unemployment. Even before the late-2025 growth surge, the federal budget was running deficits of roughly 5% of GDP, a configuration more typical of recessions than expansions. Deficit spending boosts current output by injecting demand into the economy, but it does so at the expense of higher debt burdens and added inflationary pressure later on. The same dynamic applies to household borrowing. Easy credit can temporarily elevate consumption, until servicing costs and balance-sheet constraints reassert themselves.
Even official measures of “real” GDP can mislead when inflation is uneven or understated. Headline price indices are averages, and they don’t necessarily reflect the lived inflation faced by different income groups. Research shows that low- and middle-income households have experienced cost increases well above the official Consumer Price Index. One analysis found that since 2001, the true cost of basic living needs rose roughly 1.3 to 1.4 times faster than CPI, with living costs up 83.8% versus CPI’s 65.3%. If inflation is higher than measured for large segments of the population, then real growth is correspondingly lower than reported.
By late 2025, this gap had become hard to ignore. Many Americans continue to face rapid price increases in housing, food, and healthcare, even as official CPI readings hover near 3%. When earnings are adjusted for these higher effective living costs, median incomes have declined over the past two decades, contradicting CPI-adjusted narratives of steady progress. Taken together, inflation and debt help explain why GDP can look robust on paper while the underlying economy feels fragile. Once price effects and borrowing are accounted for, the growth implied by headline GDP looks far less convincing than the numbers suggest.
The Gap Between GDP Growth and Household Finances
Beneath the aggregate statistics lies a more precarious household reality. Job market headlines in 2025 have presented a superficially reassuring picture: unemployment remains modest by historical standards, yet the quality, stability, and purchasing power of work leave many households exposed.
Wage growth has been positive in nominal terms, but it hasn’t kept pace with living costs. Bank of America data show that through 2025, inflation at roughly 3% year over year has outstripped after-tax wage growth for most Americans. Middle-income wages are up only about 2%, while lower-income wages have risen a mere 1%. In real terms, many “average” workers are taking pay cuts.
For hourly and gig workers, the picture is bleaker still, with unstable hours and minimal benefits that do not register in a low unemployment rate. Labor force participation remains below pre-pandemic levels, reflecting those who have stopped looking or stitched together part-time work. Secure, full-time jobs with benefits remain scarcer than headline figures imply. Even when wages do rise, much of the gain disappears into higher living costs. Essentials now take up a larger share of family budgets than they did in earlier expansions, leaving employed households feeling pinched during what’s officially a boom.
Housing makes the pressure hard to miss. Recent years have brought record rent increases and home prices at all-time highs. Rent growth cooled in 2024, but affordability didn’t meaningfully recover. By 2022, the number of cost-burdened renter households (those paying more than 30% of income on rent) reached a record 22.4 million. Among low-income renters, 83% were cost-burdened, including 65% devoting more than half their income to housing alone. After paying rent, the median low-income renter had about $310 left for the entire month in 2022. It’s hard to argue that number looks materially better by 2025.
Similar strains show up in food and energy. Surveys in early 2024 found that nearly one in four low-income households cannot always afford enough food, and about 43% have cut back on groceries or medicine to pay utility bills. These aren’t edge cases. They’re widespread conditions in an economy described, officially, as booming.
Middle-class families feel it too, in what increasingly resembles a rich man’s recovery. Prices for big-ticket items such as homes, cars, and college tuition remain elevated, while interest rates have risen from pandemic lows, pushing up borrowing costs. To keep spending, many households have leaned on credit. Household debt has climbed to new records, reaching about $18.6 trillion in Q3 2025.
Rising balances can mask stress for a while. Spending continues and GDP benefits. But only because families are borrowing against the future. Nearly 24% of U.S. households now live paycheck to paycheck, spending essentially all income on necessities with nothing left to save. That share has edged higher year over year, driven almost entirely by worsening conditions at the lower end of the income spectrum. Wage growth there has stalled. Costs haven’t. The result is a constant series of trade-offs.
This helps explain why many Americans say it feels like a recession even as GDP grows. When housing, food, fuel, healthcare, and education rise faster than pay, families experience a personal inflation rate well above official measures. Jobs may be available, but they’re often less secure, more fragmented, and less predictable than in prior generations.
The disconnect is stark. Low unemployment, strong GDP, and high corporate profits coexist with widespread household strain. Over time, that gap erodes trust in official metrics and feeds public frustration. Most Americans aren’t denying that growth exists. They just don’t see themselves in it. Their lived reality is tightening budgets and a low-grade anxiety about the future—even as they’re told the economy is the strongest it’s been in years.
What History Reveals About Misleading GDP Growth
History offers repeated lessons about periods when strong GDP growth obscured deteriorating economic fundamentals. Late-stage booms tend to produce reassuring headline numbers that, in hindsight, rested on fragile foundations.
The late 1920s are a canonical example. U.S. GDP grew steadily, and equity markets soared, projecting confidence and prosperity. Beneath the surface, though, the distribution of gains grew increasingly distorted. By 1928, the top 1% of families captured about 24% of all income. As W.E.B. Du Bois observed as early as 1926, the country lived with “Prosperity and Depression” side by side. For many households, economic strain predated the 1929 crash, even as aggregate output suggested good times. When confidence finally broke, the illusion collapsed with it, and real GDP fell about 29% from 1929 to 1933.
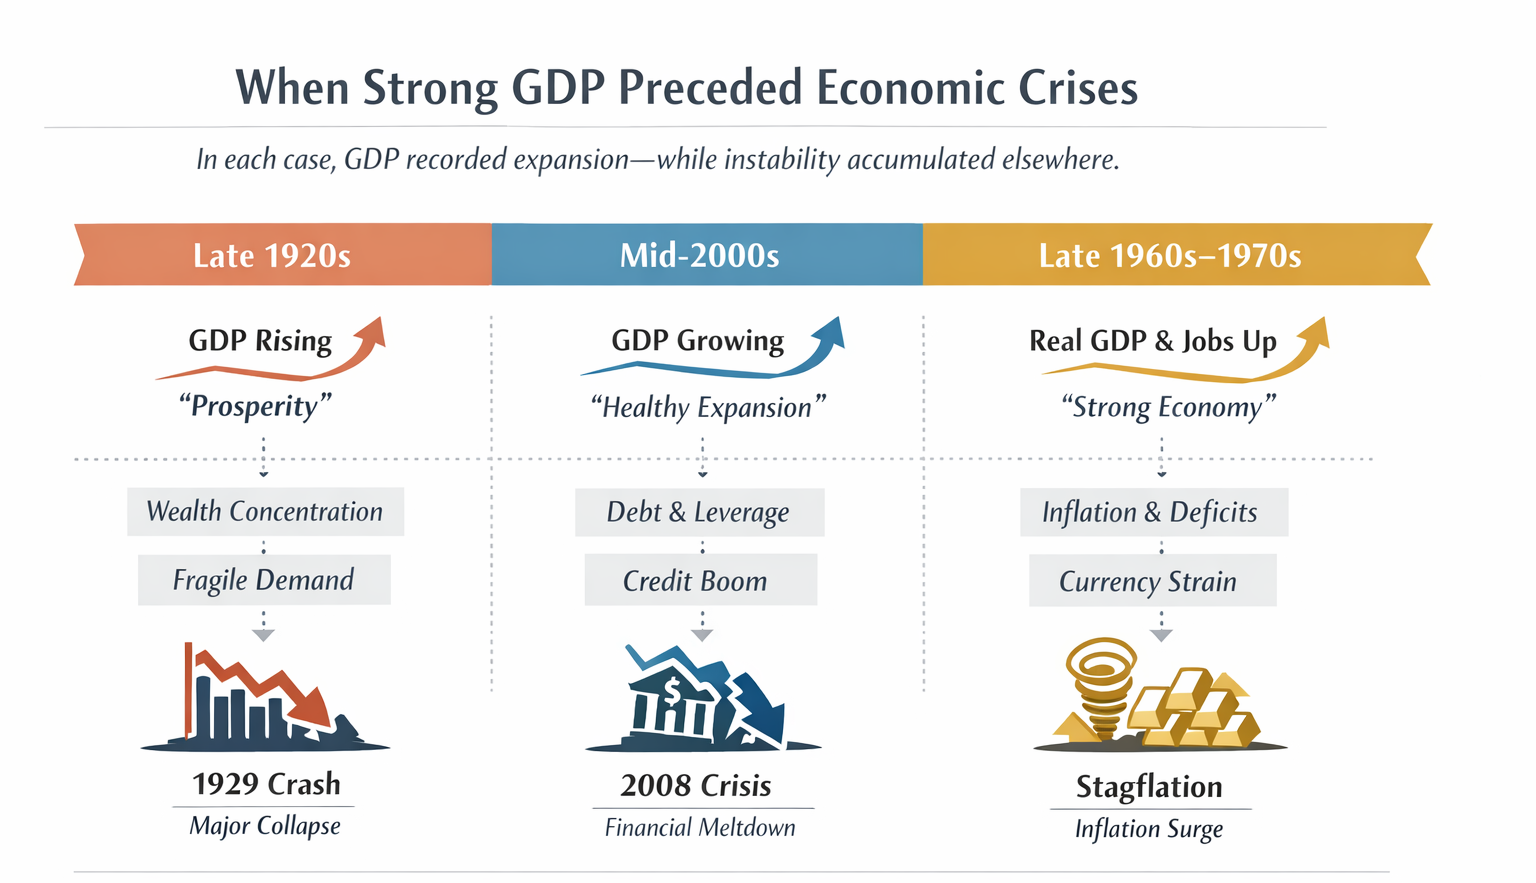
A similar pattern emerged during the mid-2000s housing boom. In the years leading up to 2007, GDP growth remained positive and, at times, robust, buoyed by a construction surge and consumer spending financed by rising home values. Official indicators offered little cause for alarm. Unemployment in 2006 stood at just 4.4%, and GDP growth averaged roughly 3% annually between 2004 and 2006. Yet the expansion rested heavily on leverage. Mortgage debt ballooned from about 61% of GDP in 1998 to 97% by 2006, driven by lax lending standards and speculative excess. Stagnant incomes were increasingly supplemented by home-equity extraction and credit, inflating consumption without strengthening underlying earning power. GDP recorded the spending faithfully. It did not capture the fragility underneath. When housing prices turned and credit tightened, financial markets unraveled with remarkable speed, and GDP followed them down in the 2008 recession. What had appeared solid was, in part, a debt-fueled mirage.
High-inflation periods reveal a different, but equally instructive, limitation of GDP. In the late 1960s, U.S. policymakers pursued low unemployment through expansive fiscal policy, funding both the Vietnam War and ambitious domestic programs, while monetary policy remained accommodative. On paper, the economy looked strong. Real GDP was rising. Joblessness stayed low. Underneath, inflation pressures built, and confidence in the dollar eroded. As prices climbed, foreign holders of dollars increasingly sought to exchange them for gold, doubting the currency’s long-term stability. That loss of faith culminated in 1971, when President Nixon suspended the convertibility of the dollar into gold, effectively dismantling the Bretton Woods system.
The episode illustrates how official metrics lose credibility when they drift too far from lived and market reality. By the late 1970s, nominal GDP continued to grow, inflated by rising prices, yet the economy was mired in malaise. Inflation and unemployment rose together in stagflation. Real incomes fell. Public trust in economic stewardship weakened sharply.
When confidence in fiat metrics erodes, behavior tends to shift quickly toward hard assets. The 1970s make the point clearly. Faced with double-digit inflation and a perceived inability of policy to restore stability, investors sought tangible stores of value. Gold, long treated as a monetary barometer, surged from $35 an ounce in 1971 to roughly $850 by 1980, an increase of more than 2,300%. It was among the decade’s standout investments. Commodities broadly saw a similar revaluation, with a major commodity index rising about sevenfold, while equities struggled to preserve real purchasing power.
This turn reflected a deeper judgment. Reported profits, bond yields, and growth figures had become unreliable guides to real wealth under inflationary conditions. Markets responded by favoring assets that couldn’t be created at will or diluted by policy.
These episodes share a common lesson. When GDP growth obscures leverage, imbalance, or erosion of purchasing power, the adjustment emerges elsewhere first, often in asset and commodity markets. Economic actors hedge against the gap long before official statistics acknowledge it, whether by exiting overvalued equities in 1929, shorting mortgage credit in 2007, or buying gold in the 1970s. GDP remains a useful measure, but history shows it is incomplete. When it misleads, the reckoning arrives regardless, and rarely on a timetable set by the data.