
By Preserve Gold Research
Markets greeted the November 2025 inflation report with unmistakable enthusiasm. The tech-heavy Nasdaq surged nearly 2% in a single session as investors moved decisively back toward risk. The S&P 500 and Dow Jones followed with strong advances, reflecting a growing belief that the Federal Reserve may pivot toward an aggressive rate-cutting cycle in 2026. Ten-year Treasury yields, which had been hovering near recent highs, slipped by roughly 5-10 basis points as the bond market absorbed the news with visible relief.
What appeared to be a “cool” inflation print arrived like an early holiday gift, igniting a rally that rippled across asset classes. From equities to corporate credit to gold prices, a sense of vindication took hold with many concluding that the Fed’s long and painful inflation campaign has reached, or may be reaching, its end.
Yet beneath the celebration, a quieter unease has begun to form. Many households, along with a growing number of economists, have sensed a disconnect between the data and lived experience. The Consumer Price Index shows inflation cooling toward the Fed’s 2% target, yet everyday expenses remain stubbornly high. This tension between falling reported inflation and persistent real-world cost pressure raises a question that could shape the months ahead. Is inflation truly cooling in a durable and self-sustaining way, or might the data be presenting an overly optimistic picture that masks deeper risks? The November CPI has brought relief, but it’s also brought a sense that the triumph over inflation might be, in part, a data-driven illusion.
What the November Inflation Report Actually Showed
After weeks of delay, the CPI report published on December 18, 2025, appeared to confirm the disinflation narrative. Headline inflation slowed to 2.7% year over year, down from 3.0% in September and well below Wall Street’s roughly 3.1% expectation. It marked the softest annual inflation reading in four years. Core CPI, which strips out food and energy, also cooled to 2.6% YoY from about 3.0% two months earlier. The short-term trend looked even more encouraging. According to the Bureau of Labor Statistics, consumer prices across October and November combined rose only 0.2%. Taken at face value, the data suggests an economy where price pressures have nearly evaporated.
A closer look at the CPI’s components reinforces that impression. Energy prices eased, helping cap the headline figure. Gasoline prices were up just 0.9% from a year earlier. Goods prices showed renewed softness as retailers leaned heavily on holiday discounts for apparel, appliances, and other discretionary items. Food inflation also moderated, with grocery prices rising about 1.9% YoY, a figure that surprised many consumers who still felt squeezed at checkout.
The most consequential shift, however, came from shelter. Housing-related costs, which account for roughly one-third of the CPI basket, decelerated sharply. Shelter inflation was reported at around 3% YoY in November. Rent of primary residence, which had been running in the high single digits earlier in the year, cooled abruptly into the low single digits. That slowdown did much of the heavy lifting in lowering overall inflation. By some estimates, shelter alone shaved several tenths of a point off the headline reading.
Unsurprisingly, markets have interpreted the report as validation of a “soft landing.” Inflation, it seemed, could fall back toward target without tipping the economy into recession. However, beneath these headline numbers lies a more complicated story. The November report did show lower inflation on paper—but the way the data were gathered and the quirks of statistical methodology suggest the story may not be as straightforward as it appears.
CPI Credibility Comes Under Scrutiny After November Release
In the wake of the CPI release, a growing chorus of economists has begun questioning whether the inflation figures can be taken at face value. The issue hasn’t been disappointment over cooler inflation readings, but rather a concern about the data’s credibility. Part of the skepticism stems from the widening gap between the CPI and consumers’ lived experience. Even as the government data has signaled “mission accomplished” on inflation, many households have been left scratching their heads because their bills tell a different story.
Beef and veal prices, for example, are up roughly 15% year over year. Electricity bills are up nearly 7%. Insurance and healthcare costs have also shown little sign of relief. Auto insurance premiums increased for a seventh consecutive year in 2025. After surging 16.5% in 2024, rates have climbed another 7.5% on average this year, pushing the cost of full coverage to more than $2,100.
Bank Buybacks Surge Ahead of Softer Capital Rules
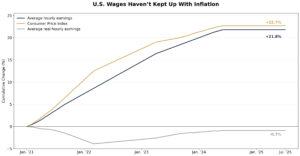
While nominal wages have risen over the past five years, the cost of living has climbed faster, leaving real purchasing power slightly negative over the period. For investors, this erosion of real income helps explain persistent household strain and rising demand for assets that aim to preserve value during inflationary cycles. Sources: U.S. Bureau of Labor Statistics, Visual Capitalist
This widening gap between measured inflation and lived reality has fueled the sense that the CPI paints an overly benign picture. And analysts have increasingly pointed not to manipulation, but to the unusual circumstances surrounding this particular report. The root cause of the trouble was the October federal government shutdown, which created a statistical black hole in the inflation series. For 43 days, the BLS couldn’t collect prices for the CPI survey and, for the first time on record, it canceled the October CPI release. When the blackout ended, the BLS faced the monumental task of estimating two months’ worth of inflation with barely one month of data.
To fill the gap, they “carried forward” September prices to October, treating the missing month as if inflation were zero. This effectively assumed that prices didn’t change at all in October. It’s easy to see how this could understate price growth. If, say, rents rose or food prices jumped during October, the CPI would not reflect that uptick at all. Those increases would either go uncounted or be lumped into November, distorting the data. As Goldman Sachs chief economist Jan Hatzius put it, this choice “exerted a significant drag on the November CPI” by essentially compressing two months of inflation into one.
The divergence is particularly glaring in shelter. By assuming zero increase in housing costs for October, the CPI showed only a modest rise in shelter between September and November, far less than one would typically expect. The shelter numbers only make sense if October inflation is zero, explained Omair Sharif, founder of Inflation Insights, calling the BLS approach “totally inexcusable.”
Critics argue that these lagged effects and statistical smoothing mask real stress. By smoothing over October, the November report likely understated the true momentum of price changes. Jason Furman, a Harvard economist and former White House advisor, blasted the shelter calculation as a “big judgment error” that likely understated actual inflation. Furman argued that the BLS “stuck to [the] algorithm rather than using judgment.” In other words, they followed their standard formulas to the letter, but in this extraordinary situation, that may have led them astray.
Others have echoed that concern. Outside analysts (and even some at the Fed) have warned that the report was so full of gaps and quirks that it should be taken with a grain of salt. Some have likened it to “Swiss cheese,” full of holes due to missing data. As Gregory Daco, chief economist at EY-Parthenon, put it, the CPI release “wasn’t just noisy and full of gaps, it provided a downwardly biased perspective of inflation” because of the way the missing month was handled.
When Statistical Shortcuts Collide With Real World Price Pressures
Understanding the November CPI controversy requires a closer look at how inflation is measured and how those methods broke down under unusual conditions. The BLS didn’t make up numbers arbitrarily. But the methodological quirks of the established procedures had profound effects on the published data.
First, consider the carry-forward imputation applied to October. Under normal conditions, when a specific price quote becomes temporarily unavailable, the BLS may carry forward the last observed price. But this time, that tool was deployed at scale. With an entire month of data missing, the agency effectively froze the CPI basket at September levels. Prices across most categories in October were set equal to the prior month, resulting in 0.0% inflation. November inflation was then calculated off that artificially flat baseline. This mechanical plug, while arguably the most straightforward option, meant that any inflation that actually occurred in October was ignored in the official indexes.
“Much of the data for October were carried forward…Shelter costs, which represent nearly a third of the index, were zeroed out in October. That does not look right,” said KPMG Chief Economist Diane Swonk, underscoring the implausibility of completely flat housing costs for an entire month. It’s not that landlords suddenly stopped raising rents. It’s that the statistical averaging smoothed away one month of rent gains. The BLS even acknowledged the issue in a technical note, stating that they are researching how the missing October data will affect the six-month rent index when it comes full circle in April 2026.
Hatzius cautioned that the same methodological choices depressing November’s inflation could produce a rebound down the line. He predicts an “artificial rebound” in shelter inflation around April 2026 (six months after the missing data), once the mechanical effect rolls through. The current methodology virtually guarantees a seesaw: artificially low inflation now, payback later.
Beyond shelter, the CPI’s more arcane adjustments further complicate interpretation. The index relies on hedonic adjustments to account for quality changes and substitution assumptions that reflect consumers trading down to cheaper alternatives. In stable environments, these tools can enhance accuracy. During periods of disruption, they often do the opposite. When prices aren’t collected, the BLS may substitute similar items or lean on historical norms. These approaches, however, can diverge sharply from what households actually paid at the register.
The scope of this estimation isn’t trivial. In September, imputed prices reached a record 40% of the index, and November likely depended on a similarly elevated share. In practical terms, a meaningful portion of the CPI was built from estimates rather than direct observations. That’s not a scandal per se—it’s how the system is designed to handle missing data. But when close to half the index rests on inferred prices, one has to wonder how well the output reflects actual conditions.
One additional adjustment in this CPI release drew far less attention than the headline figures, yet its implications could be greater. The BLS quietly removed long-term care insurance from its medical care CPI calculations, declaring that product “out of scope” in light of industry changes. While this might be a defensible technical update, it happened to mechanically lower the measured medical insurance inflation. A category that continues to impose rising costs on some households was effectively carved out of the index, cooling the health insurance component by definition rather than by relief.
The episode serves as a reminder that methodological consistency doesn’t always align with economic reality. The statisticians followed their rulebook, but the marketplace operates independently of their formulas. This isn’t to say the CPI is inherently flawed, but as Furman notes, the BLS may have been too rigid when good judgment might have helped reconcile the inflation reading with conditions on the ground. The cumulative effect has left even seasoned analysts parsing the signal beneath the noise. When definitions shift, data go missing, and estimates replace observations, the data are about as reliable as a groundhog’s weather forecast.
Wall Street Optimism Clashes With Main Street Financial Strain
The divide between Wall Street’s reaction and Main Street’s experience after the CPI release could hardly be sharper. While financial markets fixated on the softer inflation reading and immediately priced in a more benign future, the mood on Main Street has told a different story. For many households, talk of disinflation feels detached from daily reality. Wage growth in 2025 has been modest, and after accounting for inflation, real wages have declined for many lower- and middle-income workers. At the same time, essential expenses continue to weigh heavily on household budgets.
Faced with sticky costs and wages not keeping up, many households have turned to credit to make ends meet. US credit card debt has surpassed $1.3 trillion in 2025, setting a new record. Average balances among borrowers who carry debt month to month rose roughly 8% over the past year. With credit card interest rates exceeding 20%, this reliance on borrowing comes at a steep cost. Delinquencies have also begun to rise, which is often an early signal of mounting financial strain. For many families, the apparent easing in inflation hasn’t translated into breathing room. It’s been bridged with debt.
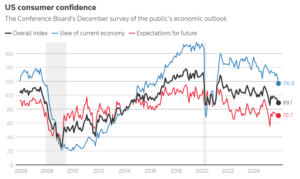
Consumer sentiment has begun to reflect that strain more clearly. Confidence deteriorated in December as anxiety around income growth deepened, a shift that aligns with economists’ expectations for a sharp moderation in consumer spending after its surge in the 3rd quarter. The Conference Board reported that its consumer confidence index fell 3.8 points to 89.1, undershooting forecasts that had centered closer to 91.0.
Bank Buybacks Surge Ahead of Softer Capital Rules
Major U.S. banks sharply increased share buybacks heading into 2025, with JPMorgan, Wells Fargo, and Bank of America leading a broad industry push to return capital to shareholders. The acceleration reflects a more permissive regulatory environment and expectations of lighter capital requirements ahead. Source: Bloomberg.
The miss may appear modest on paper, but the direction matters. When confidence weakens even as inflation headlines improve, it suggests households remain unconvinced that conditions are stabilizing. If that skepticism persists, consumers could pull back more forcefully in the months ahead, which could eventually weigh on corporate earnings and broader growth.
Questionable CPI Data Raises the Risk of a Policy Misstep
The stakes in this data drama are high. If the November CPI is sending a distorted signal, policymakers and markets could misjudge their next steps at a delicate moment for the US economy. Central banks like the Fed pride themselves on being “data-dependent,” so what happens if the data itself is suspect?
One immediate risk is premature easing. If the Federal Reserve treats the 2.7% CPI print as an accurate reflection of underlying conditions, officials may conclude that inflation has effectively returned to target. That judgment could accelerate rate cuts or soften other inflation-fighting measures. Yet if true inflation pressures remain higher, obscured by methodological quirks, early easing could prove costly.
It’s not unheard of. In the 1970s, central banks let their guard down on inflation too soon and had to slam on the brakes later when inflation resurfaced. A similar dynamic could play out in 2026. If the Fed cuts rates aggressively in early 2026 under the belief that inflation is licked, only for the “inflation dragon” to rear its head again by spring (potentially when those shelter index distortions unwind), the Fed would find itself in a painful bind.
Federal Reserve leadership has already openly acknowledged this concern. Fed Chair Jerome Powell noted that they would be looking at the data delayed by the shutdown “carefully and with a somewhat skeptical eye“. The last thing the Fed wants is to lose credibility by appearing to be fooled by faulty data. If inflation wasn’t as low as thought, the Fed might have to reverse course and hike rates again or hold off on cuts, which would shock markets that had banked on a dovish pivot.
There is also the risk of reigniting inflation itself. If actual inflation remains closer to 3% or 4%, but policy responds as if it were 2.7% and falling, easier financial conditions could stimulate demand before supply pressures have fully eased. That combination could set the stage for a second wave of inflation. It could mean that by late 2026 or 2027, inflation flares back up, forcing the Fed to tighten all over again, all because of an anomalous data glitch that led to a bad policy call.
For financial markets, misreading the signal could mean serious mispricing of assets. Equity prices currently reflect confidence in falling rates and subdued inflation. If that narrative proves flawed, repricing could be swift. Valuations, particularly in rate-sensitive sectors, may face renewed pressure. Bond investors positioned for imminent cuts could be exposed if inflation readings rise and the Fed remains on hold or tightens again. Much of today’s capital allocation rests on a Goldilocks scenario of cooling prices and easier money. A realization that November’s CPI was a mirage could cause some uncomfortable adjustments.
Beyond markets and rates lies a more subtle consequence. Trust. Modern monetary policy relies heavily on credibility and clear communication. If the primary inflation gauge is perceived as unreliable, public confidence in data-driven policy may weaken. That erosion could invite political interference or fuel claims that statistics are manipulated. Some voices have already seized on the unusual CPI print, with President Trump pointing to the low number as evidence that inflation is “essentially gone,” while critics argue the data were distorted. Most experts agree the issue was technical, not political. Still, perception matters. Inflation expectations depend on faith in the numbers. If households conclude that official data do not reflect reality, expectations could become unanchored, complicating the Fed’s task.
Officials now face a delicate balancing act. They can’t dismiss the CPI outright, but they must contextualize it carefully to avoid misguiding markets. Many economists and Fed staff appear to be treating the November report as an outlier, awaiting confirmation from subsequent releases. An implicit asterisk now hangs over the data. The danger is that upcoming reports could swing sharply in the opposite direction. A catch-up jump in inflation might force policymakers back toward a more hawkish stance, unsettling investors who had anticipated a smooth glide path.
Disinflation or Data Illusion?
The November CPI report has forced many to confront an uncomfortable possibility: that the encouraging disinflation story might be, at least partly, a data-induced illusion. Yes, inflation appears to have cooled to 2.7%, but when we peel back the layers, we find a report heavily distorted by one-off events and the complexities of statistical methodology.
The evidence suggests that November’s inflation reading may have understated conditions beneath the surface. The October data blackout, paired with the BLS assumption that prices were flat during the missing month, cast doubt on the reliability of the result. Additional distortions, including housing’s multi-month averaging and changes to health insurance measurement, further obscured the picture.
This doesn’t imply inflation is spiraling out of control. But it does imply uncertainty. When signals grow noisy, skepticism becomes rational. To its credit, the Federal Reserve appears aware of the data’s limitations and has indicated it may wait for clearer confirmation before shifting policy. Markets could benefit from adopting a similar restraint rather than extrapolating a durable trend from a single anomalous datapoint.
Periods like this tend to reward humility. When economic narratives race ahead of verifiable evidence, reversals can be abrupt. If upcoming data reveal firmer inflation or revisions alter the picture, confidence built on November’s report could unwind quickly. If disinflation is genuine, additional months of consistent data will confirm it. Either outcome will clarify the path. Until then, prudence matters.
That prudence extends beyond policy expectations and into how savings are positioned. When inflation signals conflict and the policy outlook feels unsettled, concentration can increase risk. Diversification has historically served as a stabilizer when confidence in paper indicators weakens. Assets not directly dependent on monetary policy assumptions, including precious metals such as gold, are often used as hedges against inflation surprises and policy missteps. They don’t rely on perfect data to justify their role.
As markets await December and early-2026 inflation readings, the central question remains unanswered. Was November a genuine turning point, or a statistical mirage shaped by missing data and technical quirks? The answer may determine whether the recent relief rally proves durable or premature. Until that clarity arrives, vigilance is warranted. In an environment where seeing may not equal believing, balance and skepticism remain among the most valuable assets an investor could hold.