
By Preserve Gold Research
Sovereign debt rarely breaks in the way markets think it will. It usually doesn’t arrive as a missed payment or a failed auction. More often, the pressure shows up in subtler ways. Borrowing becomes more frequent. The calendar tightens. What once sat in the background starts pressing into the daily business of markets. By the time prices fully reflect the cost of complacency, much of the strain has already moved through the financial plumbing.
Washington may be approaching that threshold in 2026. For much of the past two decades, deficits could be treated as tomorrow’s problem. Growth absorbed them. Refinancing stayed cheap. Demographic pressure would land later, on someone else’s desk. The federal borrowing calendar carried that confidence. It felt orderly, predictable, almost ceremonial. Auctions cleared. Dealers absorbed the excess supply. Investors rolled Treasury positions with little more than a relative value check. None of those assumptions has collapsed. But each one has started to bend.
Deficits Move Into the Financing Calendar
The headline numbers are familiar by now. The Congressional Budget Office’s February 2026 baseline projects a federal deficit of $1.853 trillion this fiscal year, against outlays of $7.449 trillion and revenues of $5.596 trillion. Net interest alone is expected to exceed $1 trillion, and public debt is expected to approach $32.1 trillion by year-end. The deficit equals roughly 5.8% of GDP. None of that is new information for anyone who has been paying attention. What is new is the way the financing calendar itself has begun to register the cost.
The deeper drivers behind those numbers are demographic, not cyclical. Roughly 69 million Americans receive Social Security benefits in any given month. About 68 million are enrolled in Medicare. The U.S. median age has continued to rise, reaching 39.4 in 2025, and the population aged 65 and older crossed 61 million the year before.
The 2025 Trustees Report notes that total Social Security cost “exceeds total income in 2025 and all later years” under the intermediate assumptions. There’s no fiscal cliff in 2026 because the slope is already established. The $4.5 trillion in mandatory spending projected for the year isn’t a surprise. It’s the visible portion of a curve that’s been bending for years and looks poised to continue to bend regardless of which administration occupies the executive branch.
Revenue adds another layer of uncertainty. Through the first quarter of fiscal 2026, total receipts ran about $142 billion above the prior year. Customs duties accounted for roughly $71 billion of that increase. Nonwithheld and self-employment taxes added another $47 billion. Gross corporate receipts, meanwhile, fell by $27 billion, reflecting legislative changes from the 2025 reconciliation act.
That mix matters. Tariff revenue is real, but it can shift with trade flows, exchange rates, and policy decisions. Nonwithheld receipts can arrive unevenly because they depend on capital markets and the timing of individual tax payments. So the top line may grow while the cash flow underneath becomes harder to forecast. Those jagged movements don’t stay confined to budget tables. They move straight into the bill market.
The May 4 Treasury update made that clear. Treasury raised its second-quarter privately held net marketable borrowing estimate to $189 billion, up from the $109 billion it had projected just three months earlier. It also set the third-quarter borrowing need at $671 billion.
The explanation was simple, and that’s what made it so telling. Tax-season cash flows came in softer than expected. April 15 receipts, which had been expected to ease pressure on the bill book, didn’t arrive in the anticipated volume. So the financing calendar had to absorb the shortfall. That’s how fiscal pressure may become present tense. Not through a single rupture. Not through one failed auction. Through a revised estimate, a heavier quarter, and a borrowing schedule that grows less forgiving each time the cash doesn’t arrive on plan.
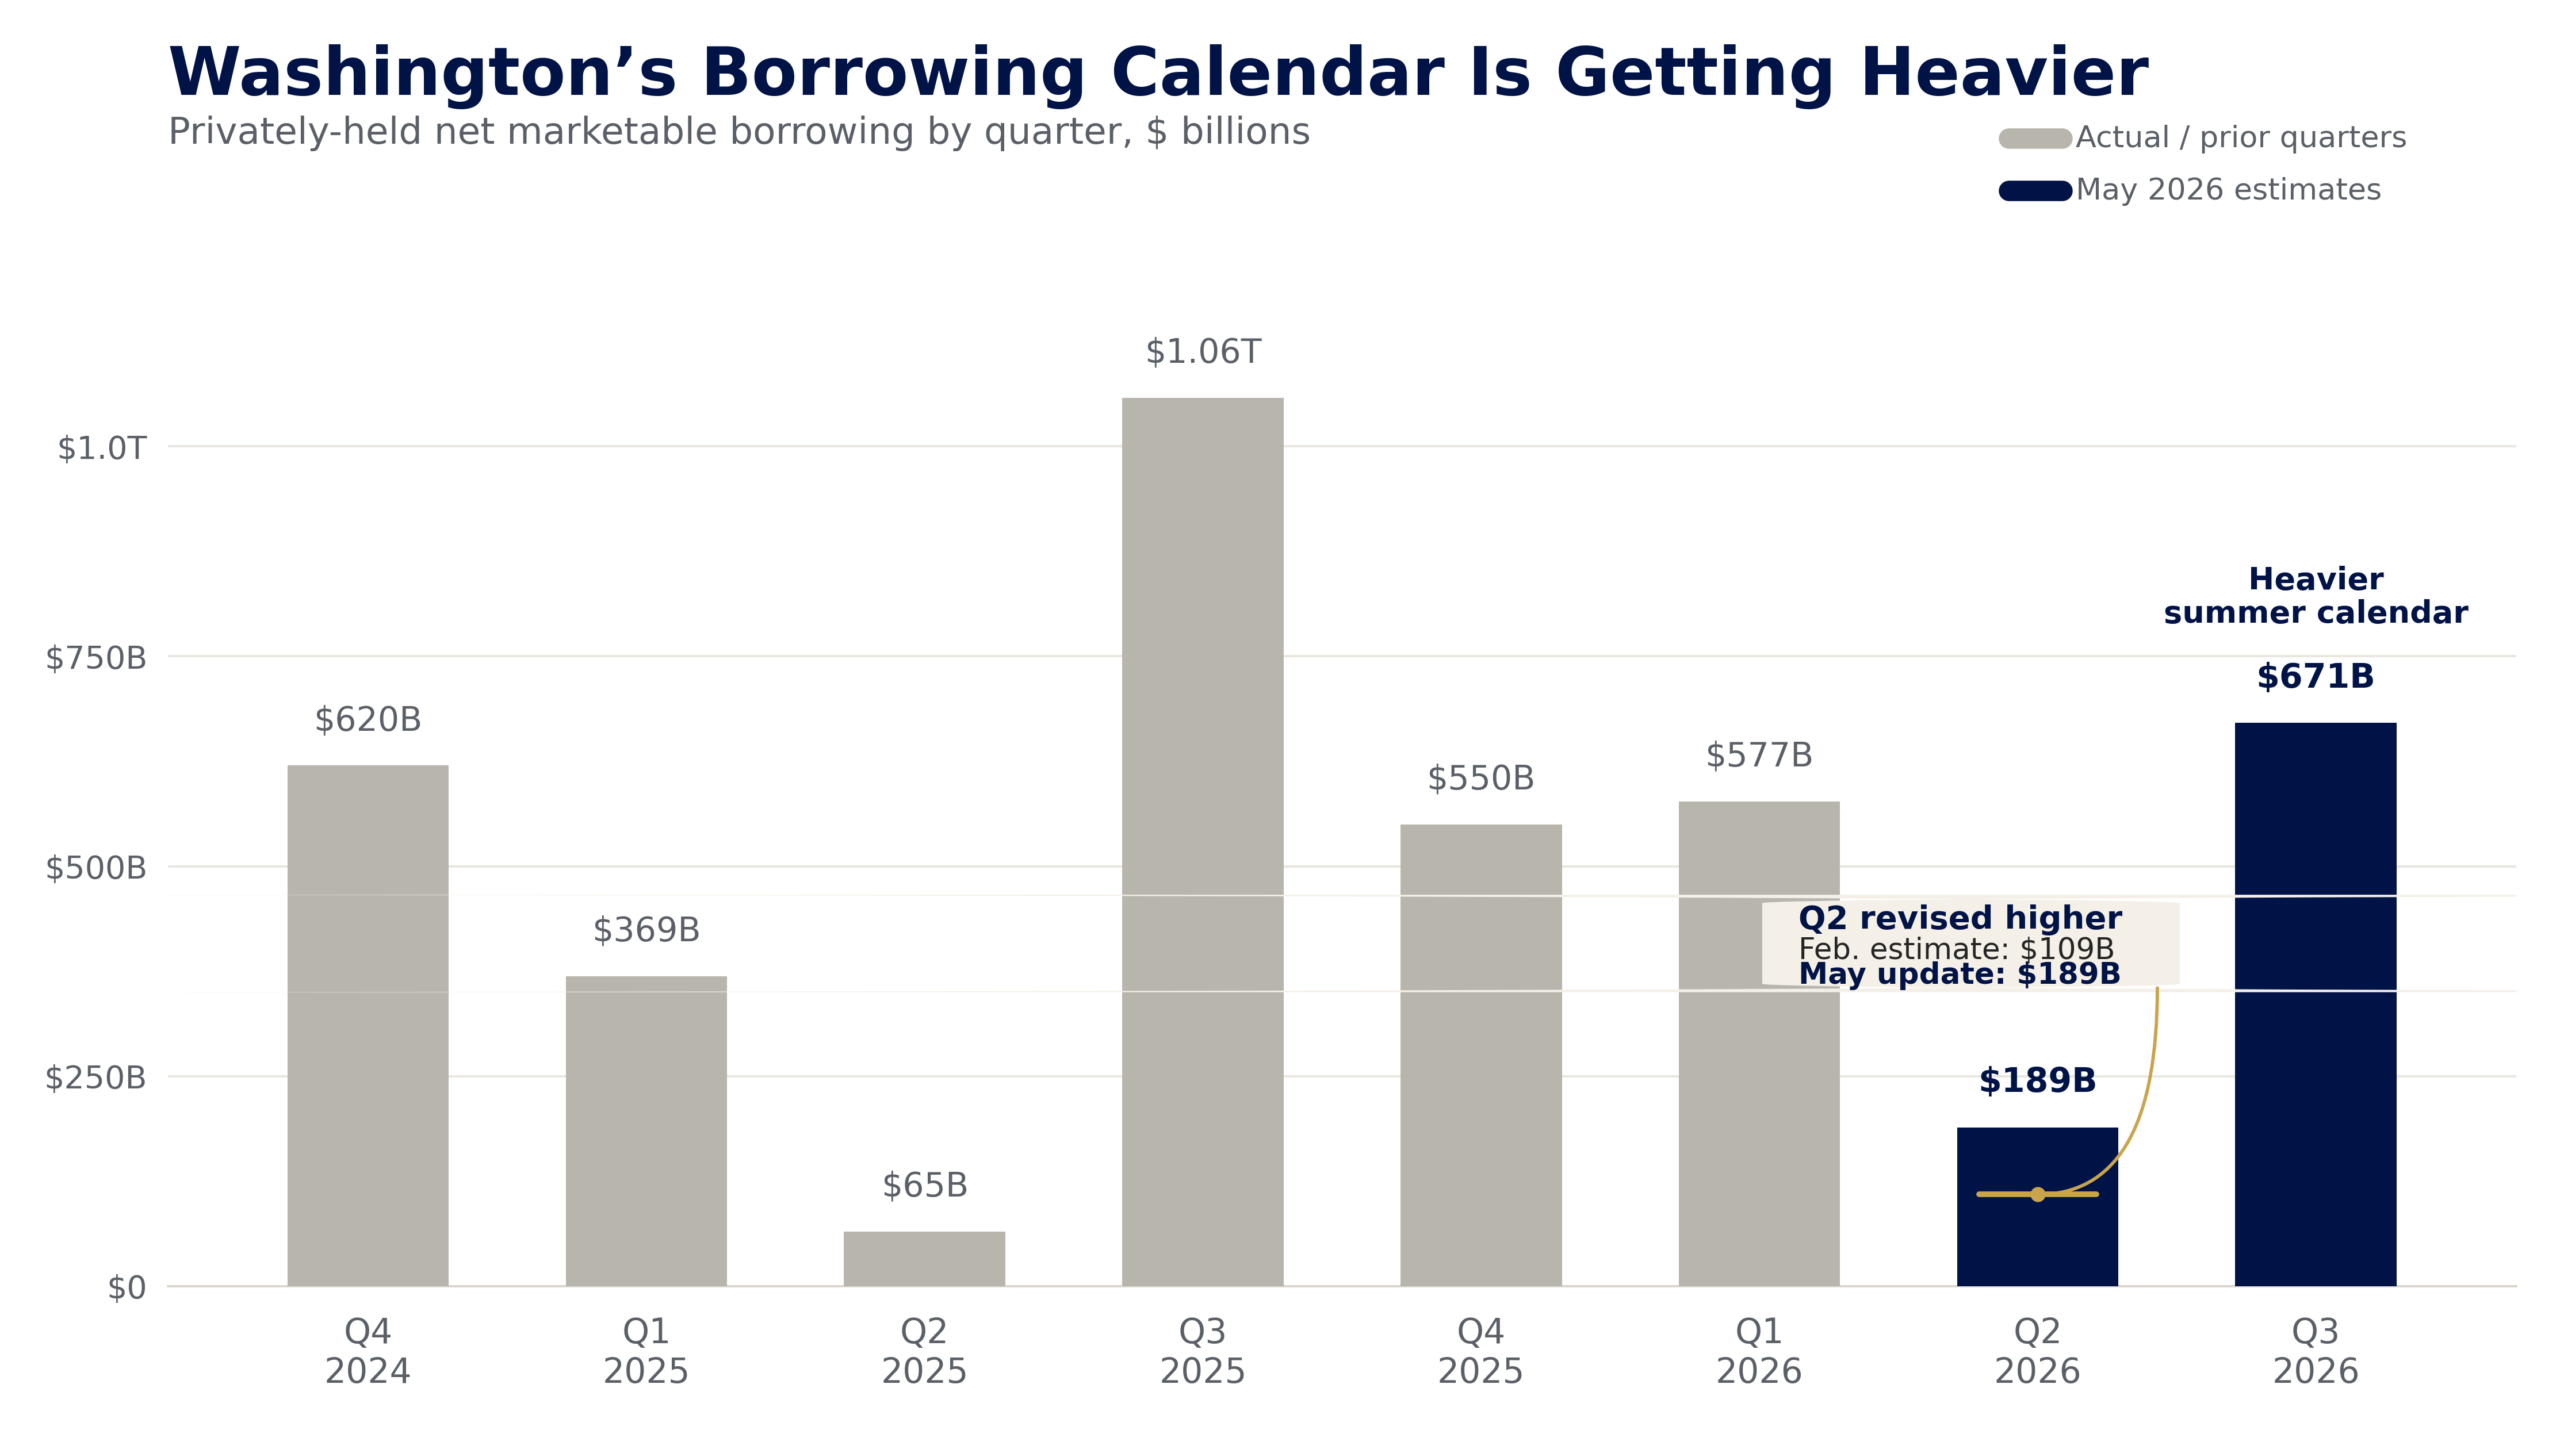
Treasury’s borrowing needs moved higher in the spring update, turning softer-than-expected cash flows into a heavier near-term financing calendar. Source: U.S. Department of the Treasury, Marketable Borrowing Estimates, February and May 2026.
Bills Absorb the Cash-Flow Shock
Treasury has answered that kind of cash-flow volatility with deliberate restraint. Its framework rests on regularity, predictability, and the avoidance of surprise. In the February 4 refunding statement, Treasury said it expected to keep nominal coupon and floating-rate-note auction sizes steady “for at least the next several quarters.” In the bond market, that phrase has become almost a stabilizing ritual. The same statement said that any seasonal or unexpected change in financing needs would be reflected in bills and cash-management bills.
In practical terms, Treasury is trying to keep the long end of the calendar calm while the short end absorbs the strain. That choice may look orderly on paper. But in the market, it creates pressure points. Coupon settlements cluster on the 15th and at month-end. Quarterly refundings arrive near the start of February, May, August, and November. Tax flows tighten around mid-April and mid-September. Year-end balance-sheet windows still push dealers and money funds into defensive positions well before December 31.
So the borrowing year isn’t defined only by the total amount Washington needs to raise. The more important question is which weeks carry too much weight at once. Auction supply, settlements, tax timing, and balance-sheet pressure can collide in narrow windows. When they do, the financing calendar may start to reveal stresses that the headline deficit number alone can’t show. April 2026 has already made that point.
A More Price-Sensitive Buyer Base
The buyer base for Treasury supply has changed as well. The Federal Reserve once held more than a fifth of the marketable Treasury stock. After the long quantitative-tightening cycle, its share has fallen to about 14%. Foreign investors now hold roughly a third of the market. Money market funds hold about 12%, households about 11%, and banks about 7%. Mutual funds, state and local governments, pensions, ETFs, insurers, and dealers make up much of the rest.
On the surface, that distribution can look reassuring. The Fed’s largely price-insensitive bid hasn’t vanished into empty space. A broader mix of investors has stepped in. But a wider buyer base isn’t always a sturdier one. Diversification can reduce dependence on any single buyer, while also shifting more of the market toward participants that demand clearer compensation for risk.
The foreign sector makes that change harder to ignore. For years, central banks and reserve managers provided a steady, relatively price-insensitive bid for Treasurys. That pattern has weakened. Foreign private investors became the majority of foreign Treasury holders in 2023, and their lead has continued to widen. They’ve added roughly $1.3 trillion in Treasury holdings, while the foreign official sector has added only about $0.1 trillion.
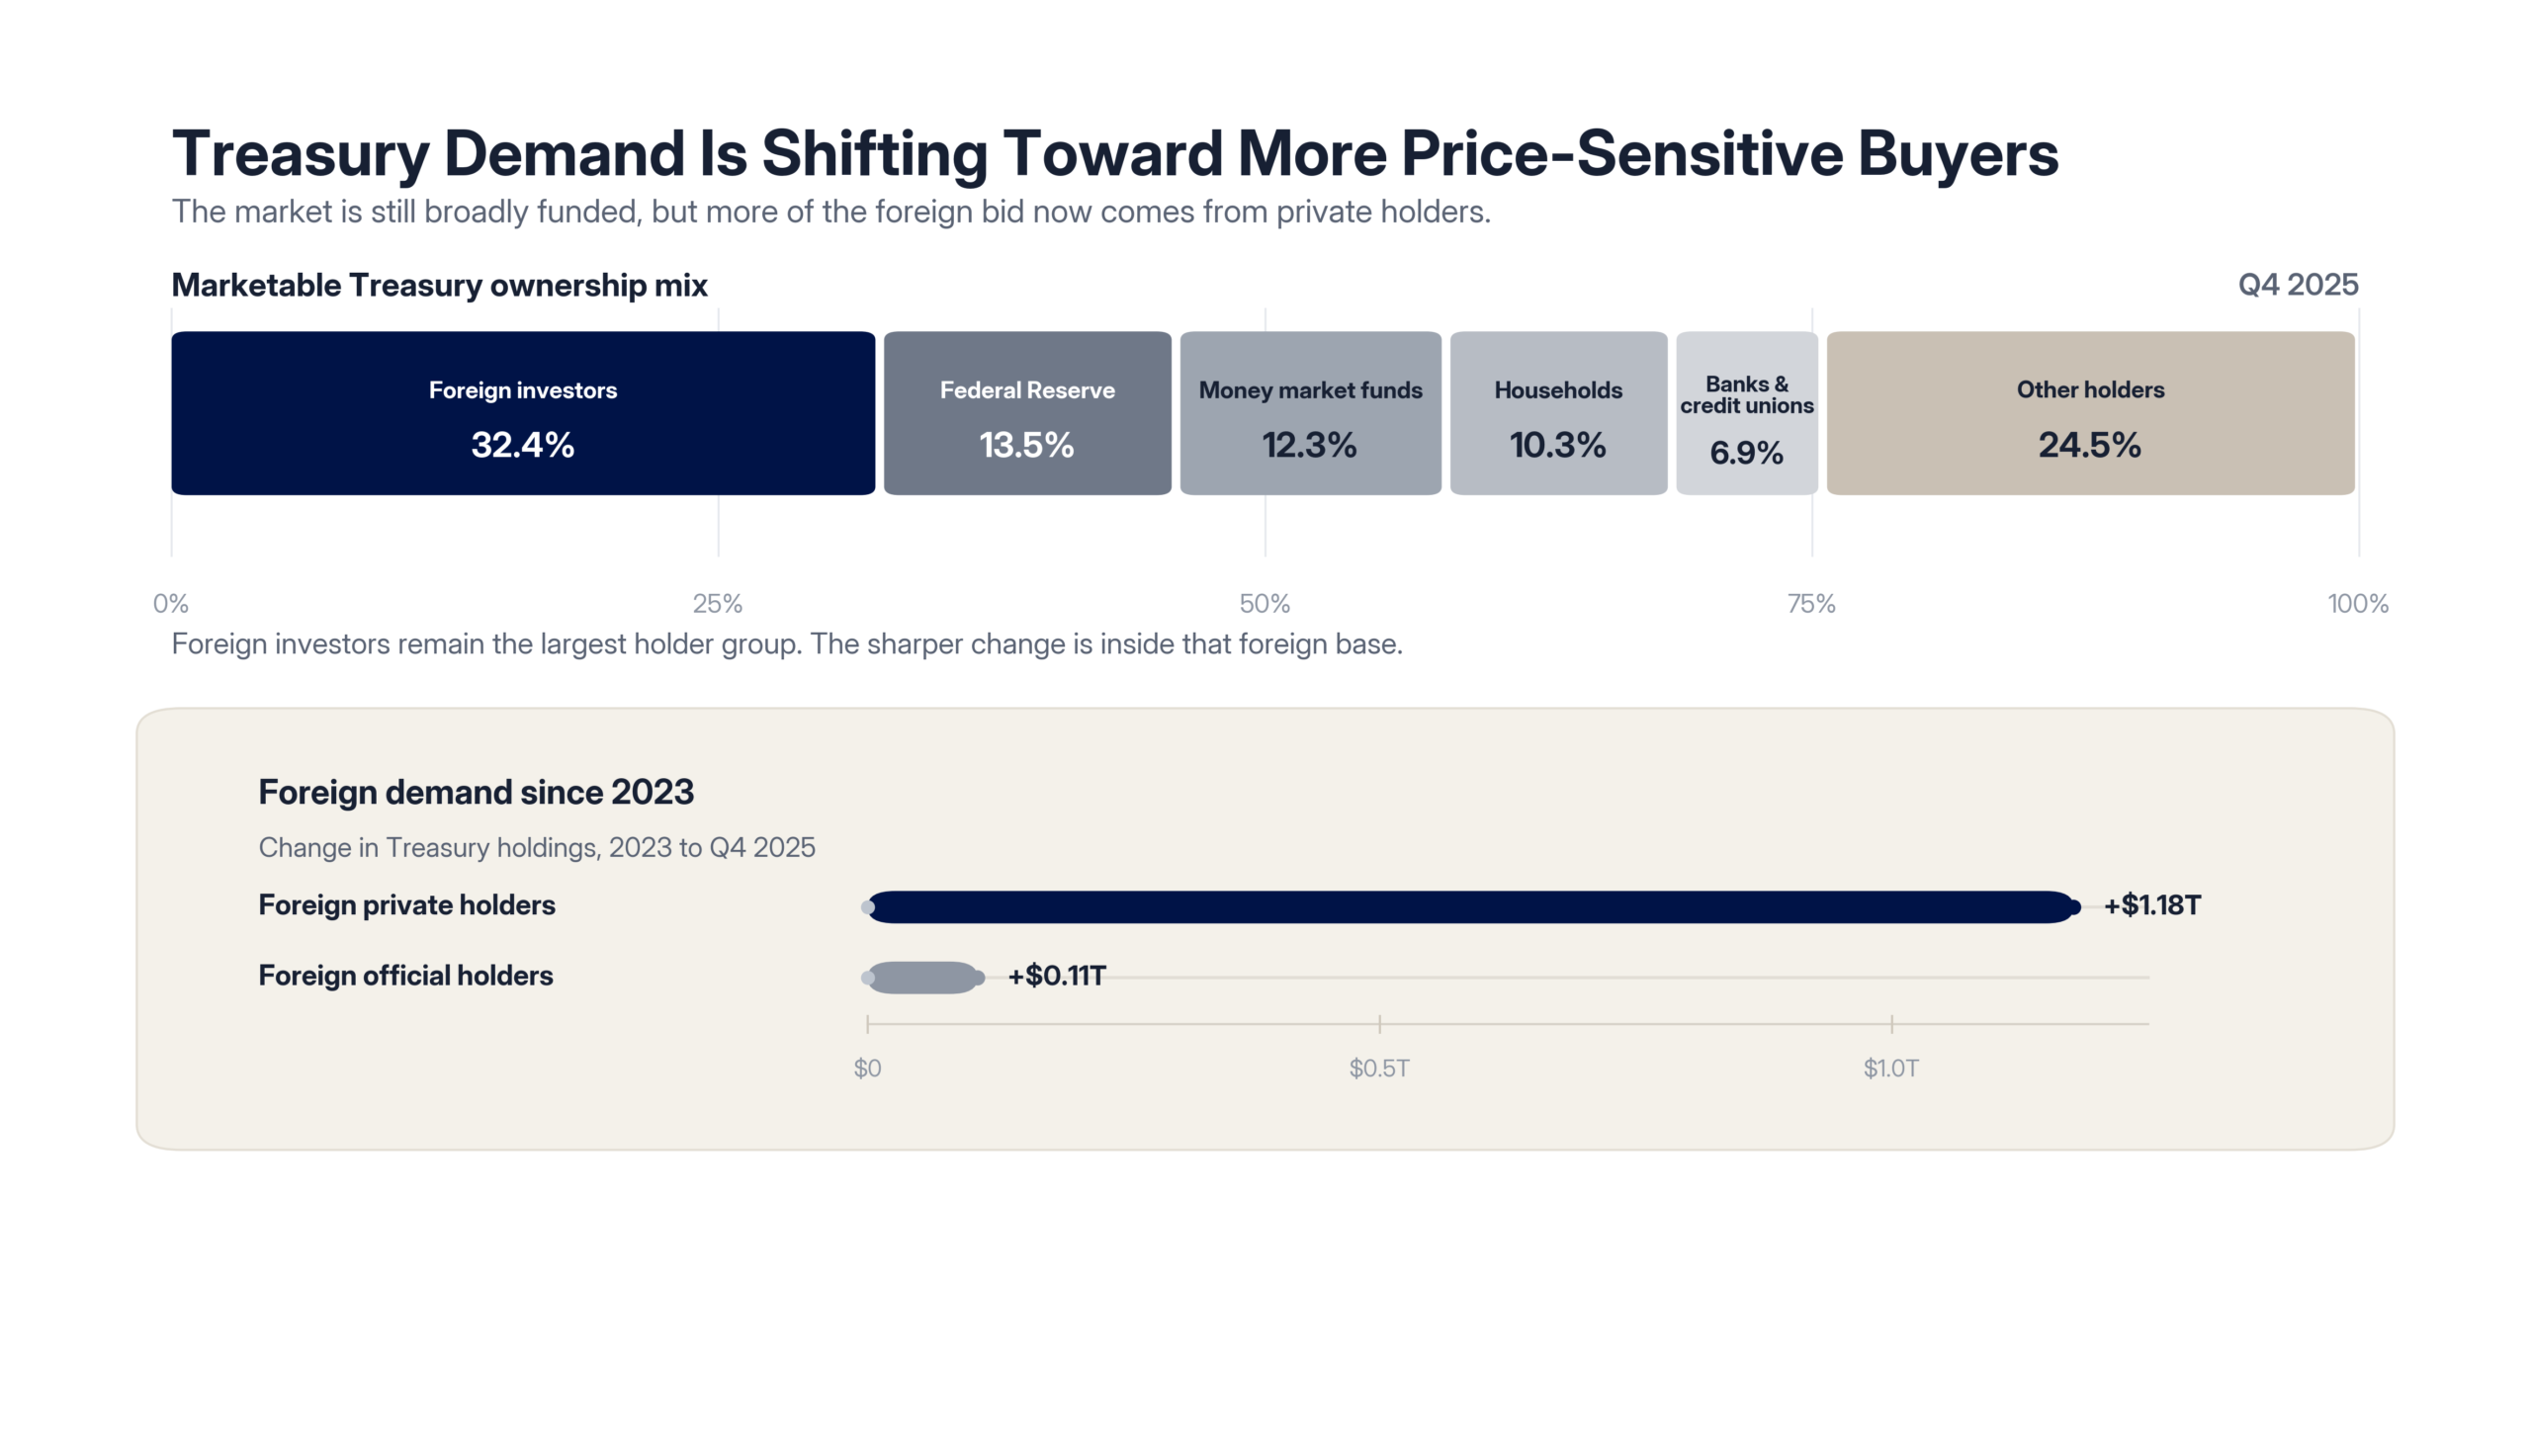
Treasury demand remains broad, but the marginal buyer has become more sensitive to price, hedging costs, and relative value than the official reserve managers that once dominated foreign demand. Source: Federal Reserve Financial Accounts; Treasury International Capital; U.S. Treasury Office of Debt Management.
That matters because private buyers behave differently. They may reach further along the curve, but they also watch hedging costs, currency swings, relative value, and the broader cycle. The same pool of foreign demand can still look large in headline terms while becoming far more sensitive at the margin.
Recent auctions in spring 2026 show the tension. Bid-to-cover ratios at benchmark sales have held up. The April 10-year reopening cleared at 2.43. The 20-year came in at 2.68, and the 30-year at 2.39. Indirect bidders, the category that includes many foreign accounts, took the majority of accepted competitive awards in each case. Primary dealers absorbed only about 10% to 12% of accepted awards, which suggests end investors have not stepped away.
Still, the cover ratios tell only part of the story. The market cleared, but at a price. The 10-year reopening went off at 4.282%. The 20-year cleared at 4.883%. The 30-year cleared at 4.876%. Treasury is still finding buyers. It’s just paying more to secure them.
The broader curve points in the same direction. As of early May 2026, the 3-month constant-maturity bill yielded 3.7%, the 2-year 3.95%, the 5-year 4.08%, the 10-year 4.45%, and the 30-year 5.02%. Those levels sit well above the CBO baseline for the year, which had assumed an average 10-year yield near 4.1%.
The market is already demanding more compensation than the official forecast expected. That could reflect inflation concern. It could reflect fiscal strain. It could simply be the price investors now require to hold duration in a less settled environment. Whatever the cause, the message is hard to ignore. Long-term money is getting more expensive while Washington’s borrowing needs keep rising.
When Supply Meets Fragile Intermediation
The relationship between supply and yields isn’t linear, and that’s what makes the heavier calendar uncomfortable. In calm markets, when dealers can fund inventory cheaply, and end investors are flush, additional Treasury supply often shows up only as modest auction concessions and a slow upward drift in term premium.
But that can change quickly. When volatility rises, dealer capacity tightens, or foreign hedging costs jump, the same amount of supply can move yields much more sharply. The deficit matters, but the market’s ability to intermediate that deficit matters more. Two borrowing calendars that look almost identical on paper could produce very different outcomes only a few months apart.
Scenario thinking is, therefore, more useful than point forecasting. In a baseline case, calendar year 2026 net marketable borrowing could land near $2 trillion while demand remains steady. Treasury might then keep coupon sizes broadly stable and use bills to manage seasonal swings. The market impact would likely appear in auction windows first, with concessions around supply dates and a slow rise in long-end term premium.
A higher rate scenario could look more strained. If roughly 100 basis points of additional repricing moved through the front end of the refinancing universe, cash needs could rise by about $60 billion to $80 billion above baseline. Bills would likely absorb much of that pressure, while longer yields could grind higher.
A foreign demand shock would carry a different risk. If private offshore buyers reduced purchases by $200 billion to $300 billion, the duration end of the curve would need to absorb the gap unless Treasury shifted more issuance into bills. If the supply mix stayed unchanged, the arithmetic could add roughly 20 to 35 basis points to the 30-year yield.
These aren’t predictions but rather stress points. And they show how quickly a manageable calendar could become more difficult if the buyer base turns cautious at the wrong time.
The debt limit channel deserves its own attention because it remains the most avoidable source of operational risk. After the July 2025 ceiling increase to $41.104 trillion, total public debt stood near $38.88 trillion in early May 2026. That left roughly $2.2 trillion of headroom, which doesn’t appear alarming at first glance.
But with borrowing running near $2 trillion a year, that cushion could shrink fast. By late 2026 or early 2027, the question of when extraordinary measures resume may return to the center of the debate. Early pre-funding tends to be cheaper than late pre-funding. Large bill maturities inside an X date window can create their own dislocations. Add political theater to an already heavier financing calendar, and every pressure point in the system could become more sensitive.
Better Plumbing, Smaller Buffers
Some of the market structure news is encouraging. A New York Fed Liberty Street Economics analysis published in April 2026 found that Treasury market liquidity had recovered after the sharp deterioration that followed the early 2025 tariff announcement. By early 2026, liquidity had reached its “best level since 2021.”
The clearing system has improved as well. The Depository Trust & Clearing Corporation now reports average daily Treasury clearing volumes of $12.2 trillion. Sponsored service activity is running near $2.5 trillion a day and growing almost 40% year over year. Those figures point to real progress in the way the system recycles collateral, nets exposures, and moves risk across counterparties. Capacity has been added in the same places where past shocks exposed the market’s thinner joints.
But stronger plumbing doesn’t mean the system has endless room. The improved infrastructure hasn’t yet been tested against a sustained, heavier issuance pace. The same Liberty Street analysis warned that volatility and liquidity remain closely linked, and that geopolitical or policy shocks could change conditions in a matter of days.
The Fed’s late April balance sheet release showed reserve balances near $2.92 trillion. The Treasury General Account stood at around $982 billion. Overnight reverse repo balances at the public counterparty facility had fallen to about $37 billion. The buffers are still there, but they’re smaller than they were two years ago. Treasury cash management can also move them quickly when funding needs rise.
For Treasury, the response menu remains limited by design. Predictability is one of the system’s most important assets. A wide-scale redesign of the issuance framework could unsettle the market more than it helps. The better course is the one already underway. Keep regular coupon and FRN sizes steady. Let bills absorb the first layer of unexpected financing pressure. Expand buybacks to support liquidity in off-the-run securities. Broaden direct access to those buybacks so more participants can recycle balance sheet capacity at the margin.
The broader shift toward Treasury central clearing may be the most important structural reform ahead. Cash market compliance is scheduled for December 2026, with the repo deadline set for June 2027. Better netting capacity won’t attract much public attention. It rarely does. But in a stressed market, it could mark the difference between a shock the system absorbs and one it transmits.
None of this solves the basic arithmetic. No issuance technique can permanently offset a structural deficit near 6% of GDP while net interest already runs above $1 trillion a year. The financing calendar serves the fiscal path, not the other way around. As long as that path remains unchanged, Treasury can dampen volatility. But it can’t make the pressure disappear.
Risk-Free Starts to Look Burdened
Some of these implications travel beyond the Treasury market itself. The largest pools of capital in the world are built on the premise that a small set of sovereign instruments serves as the foundation against which all other risks are priced. That premise hasn’t collapsed. It has, however, become harder to take for granted.
When the marginal buyer of long-duration Treasurys is a yield-sensitive private foreign account rather than an official reserve manager, the market changes. When the bill complex has to absorb cash-flow surprises that coupons were designed to avoid, the calendar changes. When net interest costs exceed the discretionary defense budget, the fiscal backdrop changes.
For investors, the response to that change tends to be redistribution. Concentration in any single set of policy-dependent assumptions becomes harder to defend when the assumptions themselves are being repriced in front of you. Cheap refinancing, steady official demand, and a subdued term premium once felt like durable features of the landscape. Now each one may have to be earned again, quarter by quarter.
Sovereign debt still anchors the financial system. That’s not the question. The more uncomfortable question is whether investors have built enough resilience above that foundation. If the base itself looks heavier, every layer above it could become more exposed than it appears.
Resilience Belongs Outside One Assumption Set
Resilience now means more than owning a balanced portfolio. It means holding assets that don’t all depend on the same chain of assumptions. Those assumptions have carried markets for years. Treasury auctions would clear without stress. Refinancing would remain manageable. Official buyers would provide steady demand. The debt limit cycle would create noise but not lasting damage. The Fed, Treasury, and dealer system would keep the machinery moving.
None of those assumptions has failed. But each has become more conditional.
That’s where diversification becomes less about return enhancement and more about reducing dependence on a single policy framework. Investors don’t need to abandon sovereign debt to recognize that its role has changed. A Treasury market that still anchors the system can also require more yield, more balance-sheet capacity, and more active management to do so.
Hard assets have historically occupied part of that defensive space. They don’t solve fiscal or eliminate volatility. Their purpose is different. They offer exposure to stores of value whose worth is not tied directly to auction demand, debt-ceiling negotiations, central-bank balance sheets, or the next turn in the refinancing cycle.
That’s why gold, silver, and other tangible stores of value tend to re-enter the conversation when sovereign funding looks less effortless. The point isn’t that they replace Treasurys. They don’t. The point is that real diversification becomes more valuable when the safest assets in the system begin to carry a heavier policy burden.
Many analysts say the 2026 borrowing calendar will be absorbed. Auctions will likely continue to clear. Dealers will continue to bid. The bill market will keep adjusting to cash-flow surprises. In that narrow sense, the system should continue to function. But functioning is not the same as ease.