
By Preserve Gold Research
Twenty million barrels of oil move through the Strait of Hormuz every day. In 2024, that single corridor accounted for about one barrel in every five consumed globally, as well as roughly a fifth of all seaborne liquefied natural gas. No chokepoint in the energy system carries more freight, and there’s no realistic way to reroute that volume when it stops flowing freely.
The World Bank’s June Global Economic Prospects cut its 2026 global growth forecast to 2.5%, the weakest annual pace since the COVID-19 pandemic. Brent crude is expected to average $94 a barrel this year, a level the Bank projects holds even under the most optimistic supply scenarios. A 2.5% reading doesn’t sound catastrophic by itself. But with an economy still recovering from pandemic-era debt accumulation, it leaves little room for a second shock before growth turns into contraction for the most vulnerable countries. Other major institutions are measuring from different angles and arriving at similar conclusions. The IMF’s April World Economic Outlook placed global growth at 3.1% under a limited-conflict assumption, while the OECD’s June Economic Outlook projected as low as 2.1% if the disruption drags through the year.
What makes this different from an ordinary commodity shock is the simultaneity. Energy prices, fertilizer supply, food costs, inflation expectations, and government finances are being compressed at once, in an economy where many of the most exposed countries have already spent down the fiscal and monetary reserves they’d normally deploy. That’s what turns a growth downgrade into something closer to a structural problem.
How a Corridor Bottleneck Became a Global Shock
In March, the IEA authorized the release of 400 million barrels from emergency strategic reserves, the largest coordinated stockpile draw in the agency’s 50-year history. Executive Director Fatih Birol framed the response directly: “The oil market challenges we are facing are unprecedented in scale.” The IEA’s March Oil Market Report characterized the supply disruption as the largest in the history of global oil markets. When the agency created after the 1970s oil shocks reaches for its biggest-ever emergency response, the designation isn’t rhetorical.
Pipeline alternatives don’t come close to covering the gap. Saudi Arabia and the UAE together have about 2.6 million barrels a day in bypass capacity, the EIA estimates. Against 20 million barrels a day of normal Hormuz throughput, that’s a partial offset at best, and it applies only to crude. Qatar ships roughly a fifth of global liquefied natural gas through the same strait. There’s no comparable bypass for that volume.
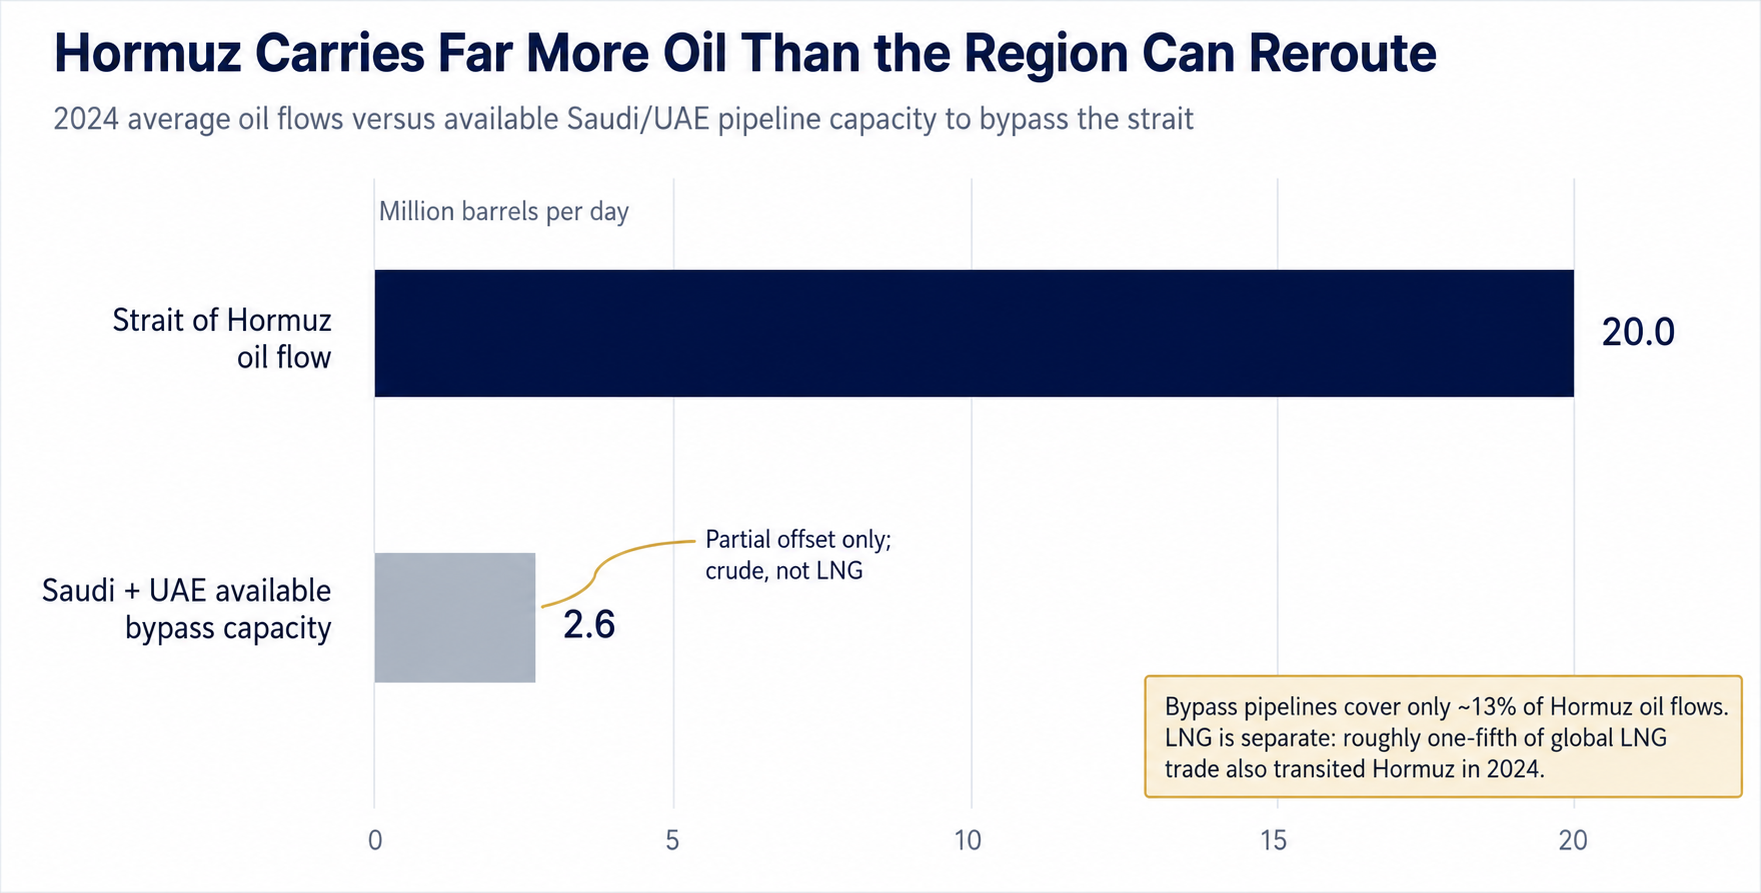
Hormuz remains the pressure point because alternative pipelines cover only a fraction of normal oil flows, while LNG has even fewer practical detours. Source: U.S. Energy Information Administration, Strait of Hormuz oil transit and regional bypass capacity estimates.
The commodity spillovers extend well beyond crude. The World Bank projects average commodity prices rising about 22% in 2026, reversing a 7% decline it had forecast in January. Fertilizer prices are expected to jump 38%. Gulf producers supplied roughly 20% of global urea and diammonium phosphate exports before the conflict began, and about a third of global seaborne fertilizer trade moves through the strait each year.
Energy and agriculture aren’t separate problems in this shock. They run through the same narrow channel, and the disruption hits both at once, worsening the compounding. Fertilizer derived from Gulf natural gas feeds crops that take months to grow and more months to reach consumers. An energy disruption that starts in spring doesn’t show up as a food price problem until fall, at the earliest. By then, the initial shock may look contained in headline inflation figures while the secondary effects are still building.
A fertilizer importer that sourced urea from Gulf producers before the conflict is now paying substantially more to reroute through alternatives, when alternatives exist at all. Farmers across South and Southeast Asia are making input decisions now, under price conditions no pre-conflict forecast anticipated, that will shape harvests months later. The economic reach of a single corridor disruption runs that long.
Fertilizer, Freight, and the Food Problem Brewing Downstream
The food consequence tends to get compressed into a single line in institutional forecasts before being set aside. The World Bank’s baseline projects food commodity prices rising about 3% in 2026, which sounds manageable. But the same report flags that higher fertilizer costs reduce application rates, weaken yields, and push food prices up in subsequent seasons. The mechanism is slow-moving and lagging, making it easy to dismiss until it shows up on grocery receipts.
The WFP projected in March that nearly 45 million more people could fall into acute food insecurity if the conflict persisted and oil stayed above $100 through midyear. By early June, the agency said the scenario was “now unfolding” in parts of Somalia, Sri Lanka, and Afghanistan, as fuel costs, fertilizer prices, and humanitarian logistics expenses rose.
Global macro shocks rarely show up first in falling growth charts. They appear in harder-to-measure places: skipped meals, weakening currencies, and families priced out of basic goods. When a food-aid convoy costs more to fuel, or a farmer cuts fertilizer use because prices have moved out of reach, the commodity shock has already moved from forecasts into daily life. That’s the limitation of aggregate data. By the time the damage is visible in GDP, it’s often reached the people with the fewest resources. The WFP figures aren’t just warnings about what could happen next; in some of the world’s most exposed places, they describe a crisis already taking shape.
The 3% baseline food price projection also assumes that the fertilizer disruption is gradually absorbed. If Gulf exports remain disrupted through the main planting windows in South and Southeast Asia, the yield shortfall arrives in 2027, not 2026. The forecast may be right about this year and wrong about the next.
Developing Economies Face a Shock They Can’t Absorb
The deeper problem for many governments is that the capacity to respond has already been partly depleted. Aggregate government debt across developing economies has climbed from under 40% of GDP in 2010 to more than 70% today. A country carrying that load can’t cushion fuel and food price increases as freely as one with more fiscal headroom.
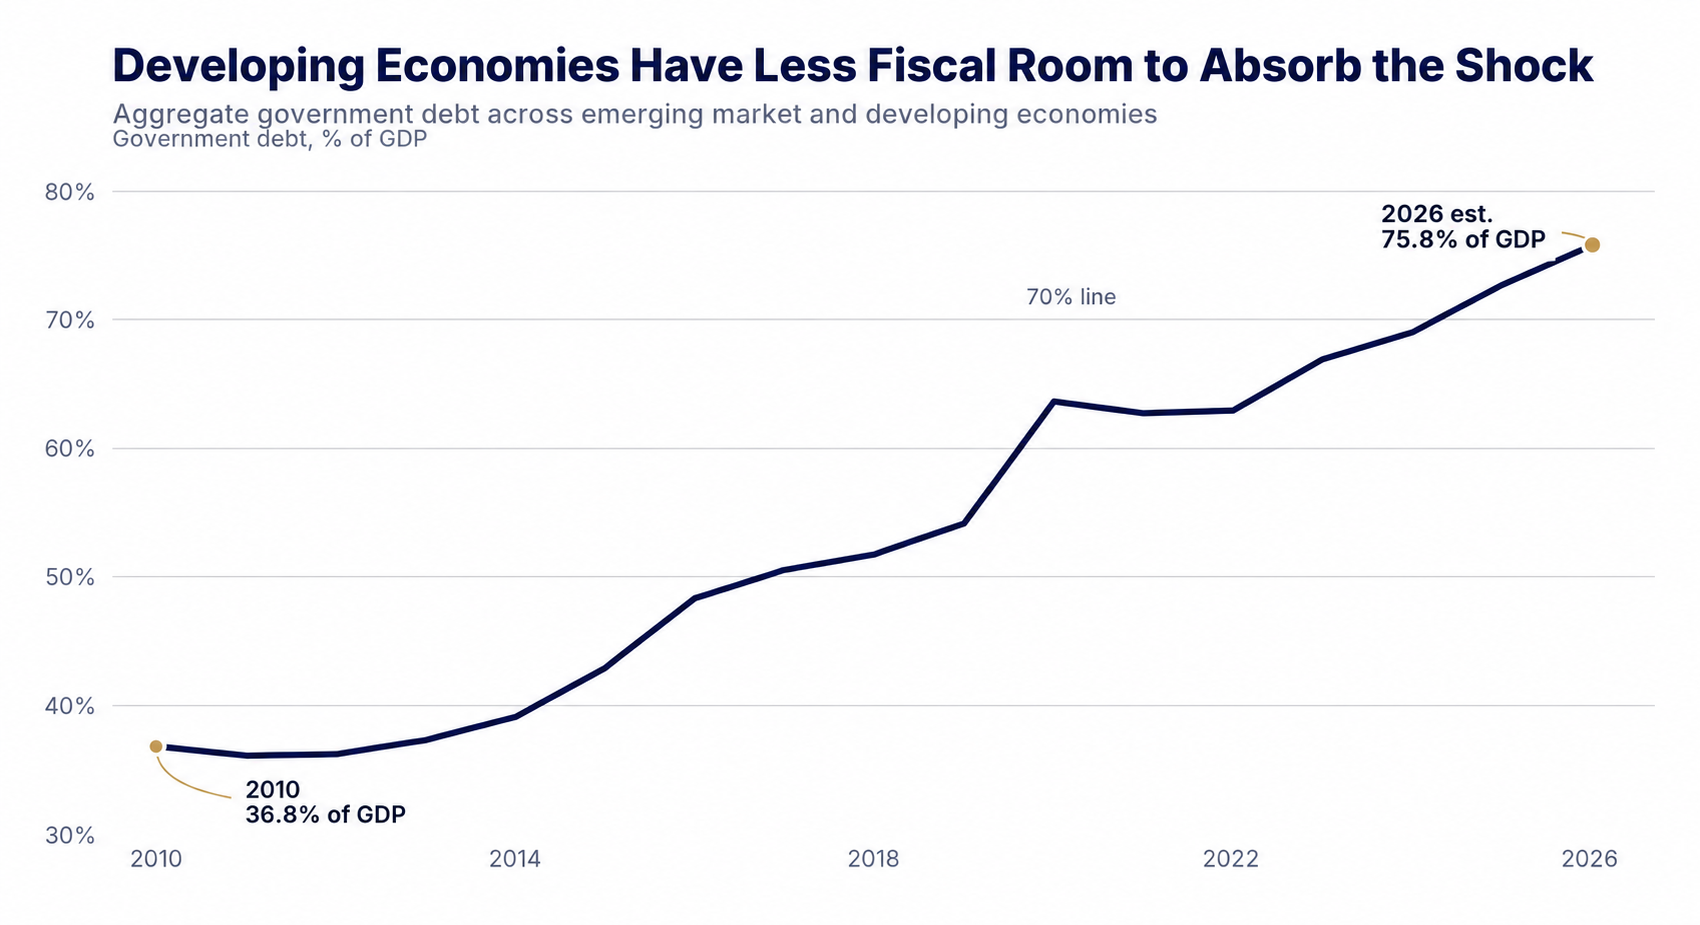
Developing economies entered the shock with debt burdens already far above 2010 levels, leaving less room for fuel subsidies, food support, or countercyclical spending. Source: World Bank, Global Economic Prospects; IMF, World Economic Outlook.
Debt service that already competes with health and education spending leaves fewer tools to protect the people most exposed to commodity swings. Fuel subsidies that would ease immediate pressure cost governments money they don’t have, and removing them risks street-level unrest. Borrowing to fill the gap pushes debt higher when global borrowing costs are already rising. When a shock hits this type of environment, social and political costs outpace fiscal costs.
The World Bank estimates that Gulf economies directly affected could see growth fall from 3.9% to near zero this year. Developing economies broadly are on track for 3.6% growth, down from 4.4% in 2025, a post-pandemic low that compounds years of compressed development progress.
World Bank President Ajay Banga described the situation in unusually direct terms. Developing countries, he said, face the same basic test: “protect people and preserve stability today, without giving up on growth and jobs tomorrow.” Both halves require fiscal resources that were already thin before the conflict began. Forecasts for two-thirds of the world’s economies have been revised lower since January. Developing economies are on track to reach 2028, having made almost no progress in closing the per-capita income gap with advanced economies, not because of the shock alone, but because the shock arrived when the gap was already widening.
Inflation Doesn’t Need to Spiral to Do Damage
The question garnering most market attention is whether the energy shock pushes global inflation back toward its 2022 peak. However, that may not be the right question to ask. The more useful one is whether prices stay elevated long enough to keep central banks cautious and households hesitant to spend. By that measure, the current picture is already uncomfortable.
BLS data for May 2026 show U.S. headline CPI up 4.2% over the prior year. Energy prices drove most of the increase, rising 23.5% year over year and accounting for more than 60% of May’s overall monthly gain. The gap between headline and core inflation matters because households don’t budget around the core measure. They pay the energy bill and the grocery receipt.
BLS May PPI data show final demand prices up 6.5% over the prior 12 months, the largest 12-month increase since late 2022. The sub-index tracking underlying business costs, excluding food, energy, and trade services, rose 5.1% year over year. When input costs run that far ahead of retail prices, businesses face a choice. They can either absorb the margin compression or pass it through, risking volume loss.
The May Beige Book shows how the pressure has moved through the economy. Prices are rising at a moderate to strong pace across most Fed districts, with energy costs tied to the conflict cited as the primary driver. Spillovers have shown up in shipping, packaging, groceries, and fertilizer inputs. Middle-income households are squeezing harder before deciding to spend. Inflation doesn’t need to return to the 2022 peaks to change spending behavior. It only needs to keep eating into the portion of income people treat as discretionary.
Why Cautious Central Banks Have Limited Options
The textbook response to a supply shock is to look through it. Prices are higher because supply contracted, not because demand surged. Tightening in this environment adds unemployment without fixing the underlying constraint. The OECD’s June Economic Outlook argues that supply-driven price increases don’t automatically require tighter policy as long as inflation expectations stay anchored. The IMF’s April financial stability report reached a similar conclusion. Central banks may benefit from holding steady, assuming policy was appropriately calibrated before the shock hit.
That reasoning is sound in theory. In practice, inflation expectations aren’t anchored by logic. They’re held in place by credibility built over years, and credibility erodes when prices keep surprising upward. A central bank that looks through one supply shock loses some of the institutional standing it needs to manage the next one. The Fed can afford to look through a temporary energy spike. But it can’t afford a second one that arrives with credibility already damaged by the first. The OECD’s instruction that policymakers should “remain vigilant” signals that even the institutions arguing for patience know the window is narrow.
The Federal Reserve held its target rate at 3.50 to 3.75% at the April 29 meeting. Chair Powell acknowledged the near-term pressure at his press conference: “In the near term, higher energy prices will push up overall inflation.” He added that the scope and duration of the conflict’s economic effects remained unclear. That’s central bank language for holding steady while watching carefully.
The World Bank’s downside scenario maps what policymakers are managing around. Global growth could fall to 1.3% in 2026 if energy disruptions prove more severe and financial conditions tighten. Developing economies with limited reserves and high debt don’t get many chances to absorb sequential shocks, and each one that lands without a policy response narrows the options available for the next.
America Has Buffers, Not Immunity
The United States isn’t absorbing this shock the way most of the world is. The World Bank projects American growth at 2.2% for 2026, and the IMF’s April forecast puts it at 2.3%. Both credit large domestic energy production as a contributing factor. EIA data show U.S. crude output set a record 13.6 million barrels a day in 2025, keeping the country as the world’s largest producer and providing both offsetting income and some insulation from global price swings.
But “less exposed” isn’t the same as safe. Energy prices running 23.5% above year-ago levels still show up in American household budgets. Consumer spending has held up, though more through resilience than comfort. Businesses face margin pressure that can’t always be passed through without a cost to volume. The OECD notes that dollar strength has provided some import-cost relief but has created headwinds for exporters and multinationals translating foreign revenue into dollars.
There’s also a broader channel that gets overlooked in the resilience story. If Europe, Asia, and commodity-importing developing economies slow more sharply than the U.S. baseline implies, those effects eventually reach corporate earnings, export volumes, and credit conditions. The U.S. may be better positioned than most. But it’s still fully embedded in a global economy where the slowdown is broad, and the distribution of pain is uneven. A significant deceleration in emerging markets and Europe would show up in S&P 500 earnings, in freight volumes, and eventually in credit spreads.
Markets Are Functioning, but the Cushion Is Thin
The IMF’s April financial stability report described conditions as “orderly so far.” Yet, equity prices globally have fallen, and bond yields have risen since late February, with emerging-market assets hit hardest in commodity-importing countries. Orderly doesn’t mean comfortable. It often means the strain hasn’t yet crossed the line into dysfunction, while the conditions that could push it there continue accumulating.
U.S. equities have recovered more ground than most, led by technology and energy shares, though that resilience has a concentration problem. The IMF flags that the conflict interrupted a stock rally partly built on capital spending from large technology companies scaling AI infrastructure. If growth slows further, the optimism embedded in those valuations rests on the assumption that AI investment continues at pace in an environment where margins are compressing and borrowing costs are rising. One of the few growth engines clearly offsetting the war’s drag is also the market’s most crowded long position. A prolonged conflict that undercuts those capex assumptions doesn’t just slow growth. It removes one of the arguments propping up current valuations.
The IMF also warns that repeated supply shocks have eroded the traditional hedging relationship between stocks and bonds. In a conventional downturn, falling equity prices are typically offset by rising bond prices, cushioning the overall portfolio. In an inflationary supply shock, both can fall together.
High public debt, rollover pressure in sovereign bond markets, and rising leverage in private credit are all conditions the IMF has found as potential amplifiers if the disruption proves prolonged. That’s a different kind of vulnerability than most portfolios have been structured to manage. The standard framework assumes that a bad year for equities is offset by a good year for bonds. If both are under pressure from the same shock, the diversification that most allocation models count on isn’t there. Investors manage through those periods, but they manage with less cushion than they assumed they had.
What Resilience Looks Like When the Buffers Are Gone
The institutional consensus has converged on a short list. The World Bank, OECD, IMF, and IEA all point toward the same priorities: target support at the most vulnerable, preserve price signals, and diversify energy supply chains. World Bank deputy chief economist Ayhan Kose offered the constructive frame: “The conflict has taken a toll on global activity, but every crisis also brings an opportunity.” The opportunity he means, stronger institutions and more resilient infrastructure, is real. It’s only accessible to governments that survive the immediate pressure without first exhausting their fiscal headroom.
For institutional portfolio managers, the environment has already prompted adjustments. The World Bank’s latest commodity data show precious metals prices running roughly 42% above last year’s average, supported by safe-haven demand. The World Gold Council reported net central-bank purchases of 863 tonnes in 2025 and an additional 244 tonnes in the first quarter of 2026 alone.
In the Council’s 2025 central bank survey, roughly 95% of respondents expected global reserves to rise over the following year. Central banks aren’t momentum traders. When a strong majority signals it will add to reserves in the year ahead, the reasoning tends to be structural: reserve diversification, crisis performance, and protection against purchasing-power erosion in an environment where conventional policy tools have less room than they did before. That accumulation has been underway for years. The current shock is just reinforcing it.
The fragility this conflict has exposed wasn’t hidden. Hormuz has been called a critical chokepoint for decades. Gulf producers’ share of global fertilizer exports has been in trade data for years. Developing-economy debt has climbed since 2010. What the Iran conflict has done is move those vulnerabilities from theoretical to operational, from risk scenarios in policy papers to supply disruptions visible in commodity prices, food insecurity counts, and central bank reserve decisions. The Iran war didn’t build these conditions. It revealed them.