By Preserve Gold Research
A gallon of regular gasoline averaged $2.57 in January 2020. By May 2026, it averaged $4.65, according to Bureau of Labor Statistics price data.
That’s not an inflation reading that Americans need a chart to understand. It’s the number on the pump, and it moved almost everything else with it. Eggs rose from $1.46 to $2.19 a dozen and ground chuck climbed from $4.10 to $6.72 a pound over the same stretch, while whole milk went from $3.25 to $4.22 a gallon and electricity rose from $0.13 to $0.196 per kilowatt-hour, the same BLS series shows.
That disconnect helps explain why so many Americans bristle when they hear the economy described as strong. For a growing number of people, it feels like their lived experience is being brushed aside.
Real GDP grew at a 2.1% annual rate in the first quarter of 2026, according to the Bureau of Economic Analysis. Unemployment held at 4.2% in June, while payrolls added 57,000 jobs, according to BLS jobs data. Real consumer spending rose 0.3% in May, per BEA’s spending report, and stocks kept trading near record highs over the same period.
None of that has shown up in Americans’ mood. The University of Michigan’s June 2026 survey put consumer sentiment at 48.9, down 13% from January and even further from a year earlier, according to a report by survey director Joanne Hsu. A Reuters/Ipsos poll found that 74% of Americans said their cost of living was moving in the wrong direction.
Aggregate economic statistics and the economy in a checking account are no longer the same economy.
Policymakers and markets track the pace of change – how fast prices are rising this month versus last. Households track the level – how much more everything costs than it used to, stacked up over years regardless of how much the monthly pace has slowed. As the 2026 midterms approach, the answer to the second question is to do more political work than to the first.
Resilience in the Data Doesn’t Mean Relief at Home
The US isn’t in a recession. Payrolls and spending are still growing, even if more slowly than earlier in the cycle, according to BLS data. Former Federal Reserve Chair Jerome Powell captured the duality when he said “the economy seems to be healthy” in the same press conference where he acknowledged that sentiment had fallen off sharply. Both statements were true; they just described two different economies.
The Fed’s own household survey shows how wide that split has grown. Its 2025 Survey of Household Economics and Decisionmaking found that 73% of adults said they were “doing okay” or “living comfortably,” while only 26% rated the national economy as “good” or “excellent,” down from 50% in 2019.
Pew Research found nearly the same split from a different angle. Its January 2026 survey put just 28% of adults rating national conditions as excellent or good, versus 72% calling them fair or poor, according to Pew’s polling. Health care costs worried 71% of respondents, food and consumer goods worried 66%, and housing worried 62%. Job availability worried only 45%, and the stock market just 20%.
That ranking says something the headline numbers miss. Unemployment is still important, but affordability has become the public’s primary concern. When people say “the economy,” they increasingly mean the price of getting through the week, not the shape of the yield curve.
Why a Cooling Inflation Rate Doesn’t Feel Like Relief
Part of the disconnect is a measurement problem. Official gauges measure how quickly prices have changed over the past year. Households judge the economy by comparing what they’re paying now with what they used to pay, with no forgiveness for the fact that the pace of increase has slowed.
Powell put it bluntly at that same press conference. “People are unhappy because of the price level,” he said, adding that on grocery bills, “they’re not wrong to be unhappy” because prices “went up quite a bit,” according to the same Fed transcript. It may be the clearest official explanation on record for why disinflation alone doesn’t translate into relief.
The numbers back him up. The consumer price index for all items stood at 257.97 in January 2020 and 335.12 in May 2026, meaning the overall price level rose roughly 30% over that stretch, based on BLS historical data. A household doesn’t get that 30% back just because this year’s increase was smaller than last year’s. It still has to earn enough to live at the new level, every month.
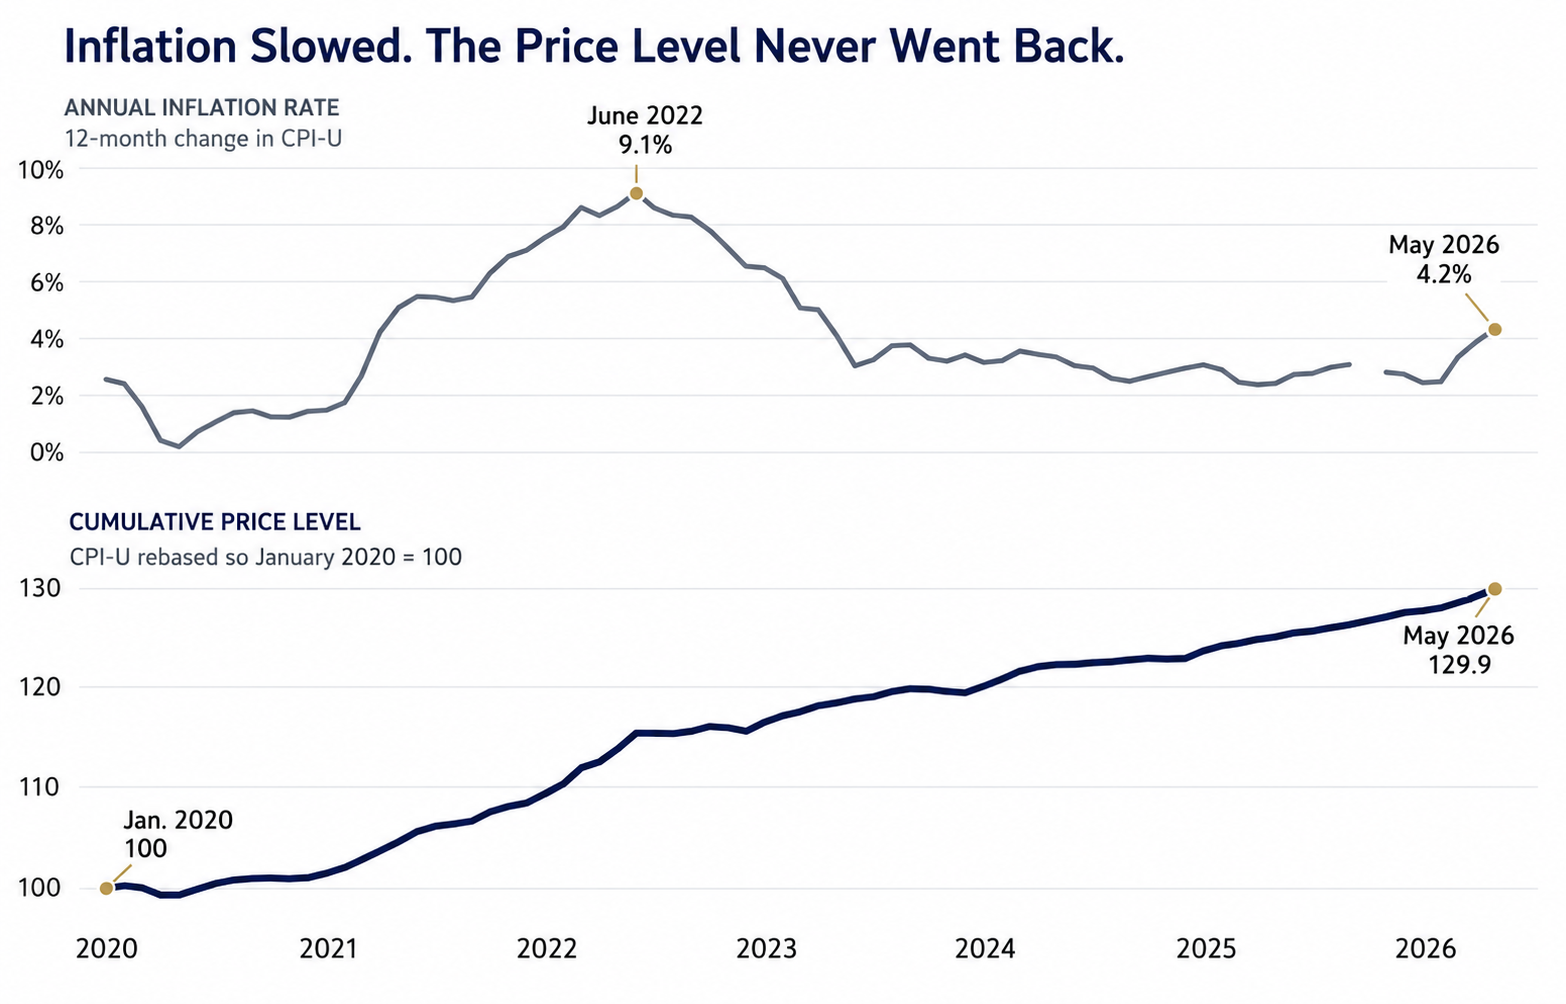
The annual inflation rate remains below its 2022 peak, but the overall consumer price level is nearly 30% higher than it was in January 2020. Slower inflation means prices are rising less quickly. It does not return household costs to their earlier level. Source: U.S. Bureau of Labor Statistics, Consumer Price Index for All Urban Consumers, All Items, U.S. city average, via FRED. Calculations based on monthly not seasonally adjusted data.
Hsu wrote in the June report that respondents “remain focused on kitchen table issues” and “feel burdened by the recent escalation in inflation.” Fifty-seven percent brought up high prices eroding their finances without being asked, up from 36% a year earlier, and 38% said inflation posed a bigger risk to their finances over the coming year than unemployment, against just 6% who picked unemployment.
The burden isn’t falling evenly, either. Hsu’s February 2026 report found that wealthier consumers felt “better insulated from any possible risks to the economy,” while Michigan’s May survey showed 55% to 61% of households with middle-sized, smaller, or no stock portfolios reporting that high prices were hurting their finances, against just 43% of the wealthiest group. A central bank can correctly say the rate has come down while a family just as correctly says the grocery bill hasn’t. Those are answers to two different questions, and the longer officials speak in rates while voters live in levels, the wider the gap in understanding grows.
Housing and Insurance Have Turned Into Structural Traps
Housing is where the aggregate story breaks down fastest, combining a price problem with a financing problem that never really eased. Freddie Mac’s weekly survey put the average 30-year fixed mortgage rate at 6.67% for the week ending July 10, 2026, according to Freddie Mac’s mortgage rate survey, off the highs of the past two years but still steep next to the ultra-low-rate era that shaped what an entire generation of buyers expected to pay.
Domonic Purviance, a housing analyst at the Atlanta Fed, described the squeeze as not softening much in a June discussion. “Consumers don’t have the ability to absorb that higher cost,” he said on an Atlanta Fed podcast. Home values, he added, “have not come back down, and incomes have not increased enough to keep pace,” leaving buyers facing a “double whammy” of high prices and high rates.
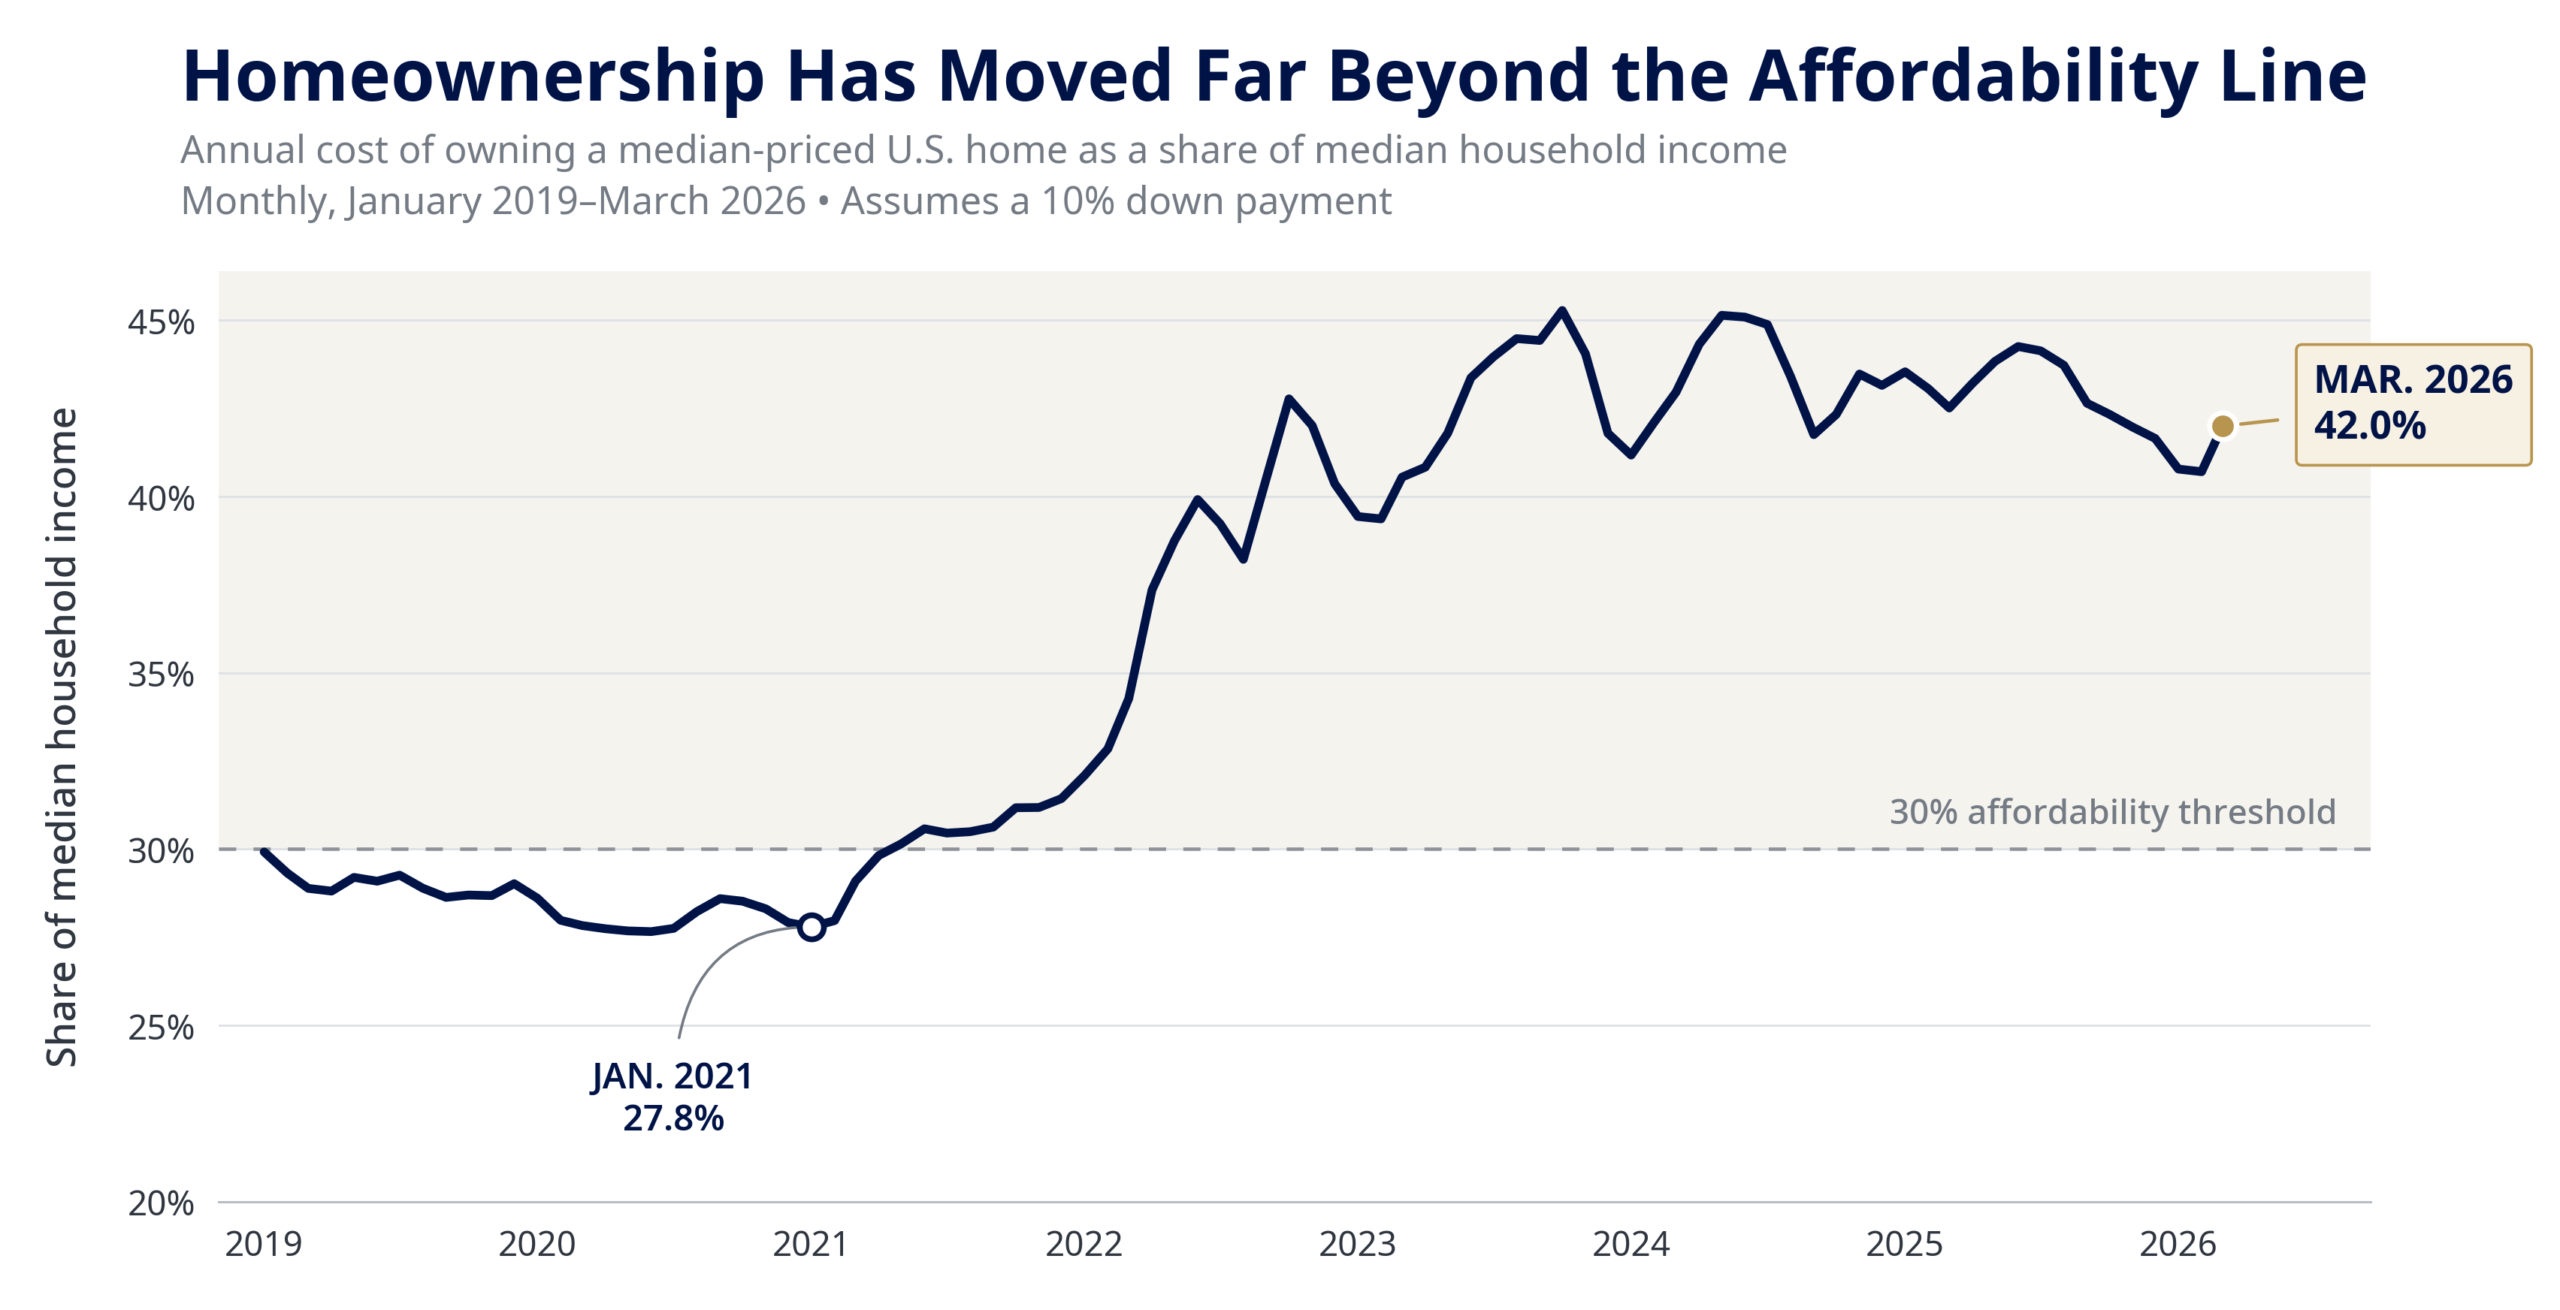
The estimated annual cost of owning a median-priced home fell below 28% of median household income in early 2021. By March 2026, it required approximately 42%, far above the Atlanta Fed’s 30% affordability threshold. The measure includes mortgage payments, property taxes, homeowners insurance, and private mortgage insurance. Source: Federal Reserve Bank of Atlanta, Home Ownership Affordability Monitor, U.S. national affordability data.
That squeeze plays out differently depending on which side of homeownership someone sits on. Purviance noted that almost 90% of mortgage holders nationally have rates below 6%, which locks many in place, since selling would mean trading a cheap loan for an expensive one. Those owners can look wealthy on paper while feeling stuck in reality, sitting on equity they can’t spend without a much larger monthly payment.
Renters face a different kind of strain. Twenty-three percent reported falling behind on rent at some point in the prior year, according to the Fed’s household survey, up from 21% in 2024 and 17% in 2021. Arrears are a cleaner signal than complaints about rent being too high. A growing share of renters aren’t just unhappy. They’re falling short.
Younger households are squeezed from a third direction. Pew reported that the home price-to-income ratio for households under 40 climbed from 2.9 in 2019 to 3.5 in 2024, nearing the peak reached during the mid-2000s housing bubble. Meanwhile, 49% of adults under 30 were living with a parent, up 12 percentage points from 2019, per the Fed’s latest household survey. A 4.2% unemployment rate doesn’t fix a down payment that keeps moving out of reach.
Insurance has become its own affordability crisis. Premiums rose 8.7 percentage points faster than inflation between 2018 and 2022, according to the Treasury’s Federal Insurance Office, and homeowners in the highest climate-risk zip codes paid an average of $2,321 a year, 82% more than those in the lowest-risk areas. Six percent of homeowners had gone without coverage entirely, mostly due to cost, the Fed’s survey found. Insurance used to be a background cost of owning a home. For a growing number of families, it’s become the line item that decides whether the budget holds.
Debt is the final pressure point, turning high prices and high borrowing costs into a squeeze from both sides at once. The Fed’s household debt service ratio, the share of disposable income going to required debt payments, reached 11.16% in the first quarter of 2026, up from 9.05% in 2021, according to Federal Reserve data.
Total household debt stood at $18.8 trillion in that same quarter, the New York Fed reported. Its December 2025 survey found the average perceived probability of missing a minimum debt payment over the next three months at 15.3%, the highest since April 2020.
Concern was greatest among lower-income, older, and less-educated respondents. Households can manage high prices or high interest rates for a while. But living with both for years creates financial strain that appears in survey data well before it shows up in a recession.
A Labor Market That’s Stable but No Longer Rewarding
Steady employment has been the strongest argument for calling the US economy resilient. But steady isn’t the same as good, especially from where a worker sits. Average hourly earnings rose 3.5% over the year in June, per BLS data, while the Atlanta Fed’s Wage Growth Tracker, which follows individual workers rather than the shifting mix of jobs in the economy, put median wage growth at 3.6%, with job stayers at 3.4% and job switchers at 4.1%.
Set those figures against the cost side and the picture changes. The PCE price index rose 4.1% in May, according to BEA data, while CPI-U rose 4.2% the same month. A lot of workers are treading water in real terms, and some are losing ground even while employed and getting raises.
Chicago Fed President Austan Goolsbee made a similar point in February, noting that “people remain especially concerned about prices” even as he described the underlying economy as steady. Powell had used a related phrase in 2025, describing a “low-firing, low-hiring situation,” and Purviance called it “slow hire, slow fire,” a climate that makes households hesitate before taking on a large mortgage.
That hesitation traces back to lost leverage, not lost jobs. The share of workers who asked for a raise fell to 17% in 2025 from 21% in 2022 and 2023, according to the Fed’s household survey. Only 60% of job changers said their new position was better overall, down from 72% in 2022.
The New York Fed’s December 2025 survey also found that the perceived probability of finding a new job after losing a current one had fallen to 43.1%, the lowest level in the series. The decline was sharpest among respondents earning under $100,000, those over 60, and those with no more than a high school diploma. Layoff figures miss this kind of weakness. It shows in the worker who stops asking for more because they no longer believe they have the leverage to get it.
The Wealth Gains Are Real, and Mostly Someone Else’s
Rising asset prices strengthen the aggregate picture, which helps explain why the economy can look healthier in national data than it feels to many households. The 2022 Survey of Consumer Finances found that 58% of families owned stock directly or through a retirement account, up from 53% in 2019, according to Fed data. That still leaves roughly four in ten families with no stake in the rally.
Even ownership doesn’t mean much exposure. Federal Reserve figures tracked by the St. Louis Fed show the top 1% held 50.2% of all corporate equities and mutual fund shares in the first quarter of 2026, while the bottom half of households held just 1.1%. A market rally is an uneven buffer against rising living costs, making national wealth appear strong while leaving the typical household with no cash-flow relief.
Michigan’s surveys picked up the same split in sentiment. Just 43% of the wealthiest households said high prices were hurting their finances in May, compared with 55%-61% among households with smaller portfolios or none. In February, a gain in sentiment among the largest stockholders was entirely offset by a decline among households with no stock holdings.
Homeownership tells a related story. Owners generally benefited from rising home values, but that doesn’t translate neatly into liquidity. The home is the largest financial asset for many American families, the Treasury noted, and insurance costs now directly shape its value from year to year. Purviance made the same point about owners sitting on “a lot of equity” they can’t easily spend. Rising paper wealth, for a growing share of the country, isn’t the same as cash sitting in a checking account.
Affordability Now Cuts Across Party, Age, and Zip Code
Political identity still shapes how people rate the economy in the abstract. Pew found that 49% of Republicans rated the economy positively in January 2026, versus just 10% of Democrats, and that gap isn’t closing soon.
But underneath the partisan split is elevated cost concerns on both sides of the aisle. Sixty-one percent of Republicans and 82% of Democrats told Pew they were very concerned about health care costs, and 55% of Republicans and 75% of Democrats were very concerned about food costs.
Income shapes the experience in degree, not in kind. Sixty-two percent of adults earning under $25,000 and 64% of those earning $25,000 to $49,999 told the Fed that rising prices had worsened their financial situation. Michigan’s June survey found that lower-income households saw the largest rebound in sentiment when gasoline prices eased, simply because gas eats up a larger share of a tighter budget.
Geography compounds the same effect. Rural households experienced inflation 0.79 percentage points above the national average through April 2026, according to the New York Fed’s Economic Heterogeneity Indicators. Hispanic, Black, lower- and middle-income, non-college, rural, and Midwestern households all ran above the national average, largely because of heavier exposure to gasoline prices, the same research series found.
Personal experience and national judgment don’t always line up either. A poll from AP-NORC found that about four in ten adults said they and their family were worse off than before the current presidential term began, while roughly half said the same about the country.
What’s Really at Stake Is Trust in the Numbers
The biggest risk isn’t which party wins the next election. It’s whether Americans still trust the tools used to measure economic success. When policymakers and the news media describe the economy as resilient while households struggle to cover food, housing, insurance, and debt payments, confidence in those measures erodes. The Fed’s own survey shows that divide. Many people feel relatively stable in their own homes while remaining deeply uneasy about the country’s economy as a whole.
Powell’s answer on grocery bills may end up mattering more than a year of statistical releases. He was speaking to more than the latest inflation rate. Prices rose sharply, settled at a higher level, and never came back down. Hsu’s surveys point to the same concern. Even as sentiment ticked up modestly in June, she wrote that consumers “remain focused on kitchen table issues.”
That credibility problem has a market dimension too. If asset prices keep climbing while everyday costs remain punishing, more Americans could conclude that the economy being celebrated mostly benefits people who already own things. It feels far less secure for those who depend on a paycheck and spend most of it by the middle of the month. The data on wealth and stock ownership give that view a real foundation.
This also helps explain the growing appeal of tangible stores of value. As trust in official measures weakens and affordability becomes the clearest test of financial stability, some households begin looking for protection that feels less dependent on government data or market confidence. Stocks and bonds can still play an important role. Gold and other hard assets are drawing renewed attention from savers who no longer see a rising index as proof of a rising standard of living.
A labor market that avoids recession is still a success. So is inflation coming down from its peak. However, neither one resolves the deeper problem of households carrying the weight of six years of cumulative price increases. Resilient GDP and a fragile household balance sheet can both be true at once. The last six years didn’t create that fragility; it merely exposed it.