
By Preserve Gold Research
Every month, the U.S. Treasury pays off a batch of bonds it sold years ago and borrows the money back at a much higher rate. On August 27, the federal government’s running total of debt reached $40.08 trillion. That’s up about $2.4 trillion since the close of 2025, and the pace hasn’t let up all year.
The size is hard to grasp. Spread across every U.S. household, it comes to around $300,000, based on Census Bureau counts of roughly 133 million households. It equals close to eight years of everything the IRS collects, which ran about $5.1 trillion in fiscal 2024. It outweighs two-thirds of the value of every home in America, next to the $55 trillion estimate for the housing stock.
Crossing $40 trillion won’t change anything overnight. The larger concern is what’s happening beneath that number. The government is rolling a large stock of low-rate debt into borrowing that costs far more. Each turn of that wheel widens the deficit and sends the Treasury back for more. Over time, interest claims a bigger share of what the country earns, and the government’s room to move shrinks with it.
How Washington Ran Up a $40 Trillion Tab
The path to $40 trillion wasn’t the work of a single administration.
Federal tax revenue has remained surprisingly stable as a share of the economy since World War II, even as tax rules have changed several times over. CBO’s February baseline puts receipts at 17.5% of GDP in 2026, close to their long-run average. Spending is where the mix shifted.
Defense spending took about 80 cents of every federal dollar in the years right after 1945, and everything else split the rest. Today, interest on the debt absorbs close to a fifth of federal spending. Defense takes another fifth, and most of what remains goes to Social Security, Medicare, and other benefits.
A confluence of factors drove the borrowing behind today’s total. Two deep recessions and the 2008 financial crisis led to large emergency deficits. So did the wars in Iraq and Afghanistan, tax cuts signed by presidents of both parties, and several trillion dollars in pandemic relief across 2020 and 202. An aging population has also contributed, lifting Social Security and Medicare outlays a little more every year as baby boomers retire.
Debt held by the public was worth roughly a third of the economy before the 2008 crisis. CBO now puts it near 99% of GDP at the end of 2025 and expects it to reach 120% by 2036. Under the agency’s longer-run projections, it surpasses the postwar record of 106% around 2030 and continues to rise thereafter.
That rising debt burden also matters because it can put upward pressure on borrowing costs. As the Treasury asks investors to absorb more debt, especially amid persistent deficits, lenders often demand higher yields. That makes new borrowing more expensive and adds another layer of pressure to future federal budgets.
The Gap Between Old Debt and New Borrowing
Most of the debt already on the books was locked in when money was cheap.
As of July 31, the average interest rate across all federal debt was about 3.45%, according to Treasury’s monthly figures. New borrowing costs are far higher. On August 28, Treasury’s yield curve put the 10-year note at 4.73% and the 30-year bond at 5.22%.
Both sit well above where they started the year, when the 10-year was near 4.2%.
The government doesn’t refinance everything at once, and that lag is what makes the squeeze easy to miss. Old bonds mature on their own schedule. As each one comes due, the Treasury replaces it with new debt priced at whatever the market demands that week. A stretch of higher yields continues to feed into the average cost for years, even after the deficit itself stops widening.
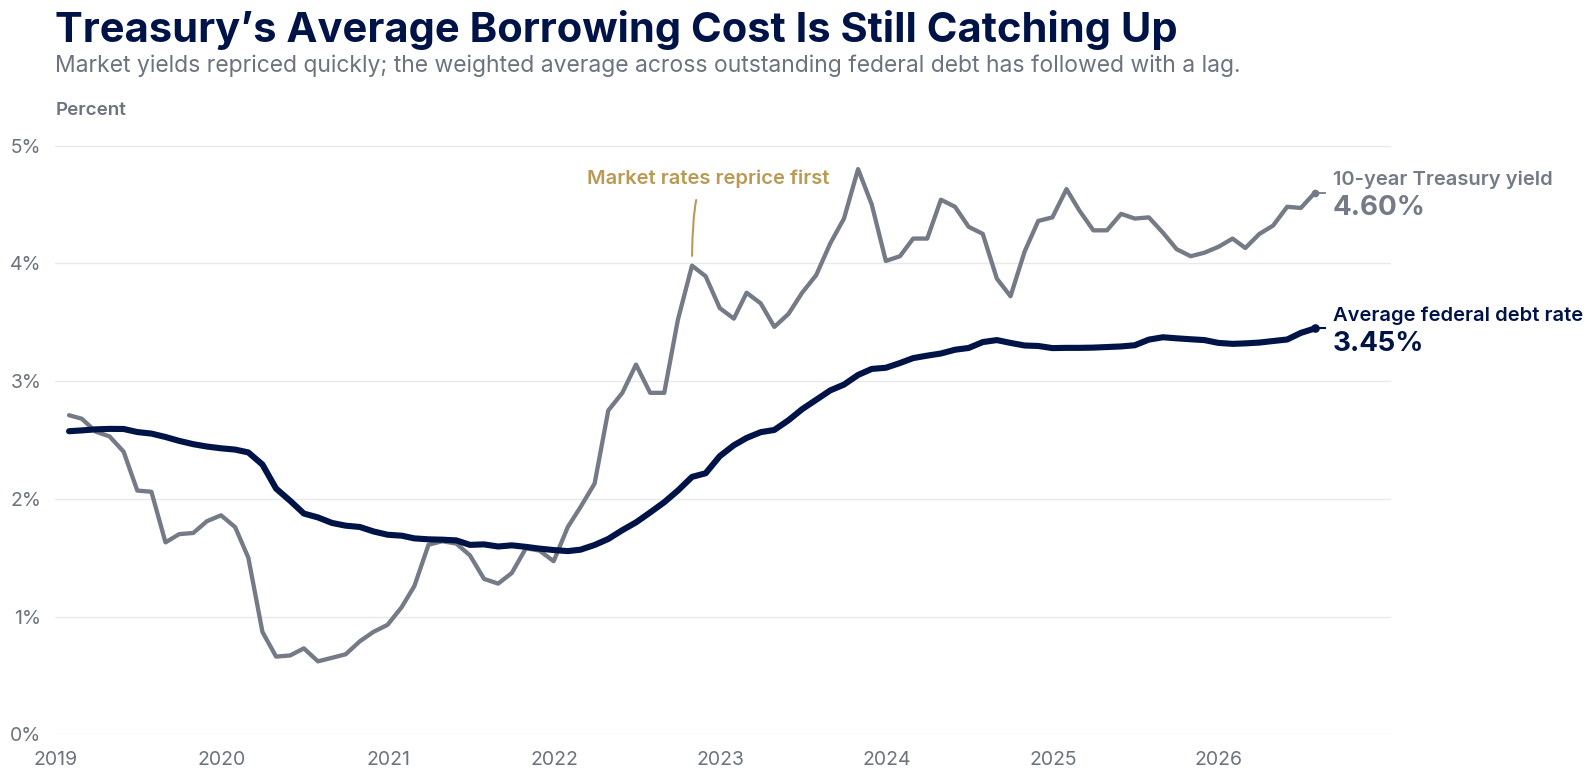
Market yields repriced quickly after the low-rate era ended. The Treasury’s average borrowing cost has risen much more slowly because older securities mature gradually, a lag that keeps feeding higher rates into the federal interest bill. Source: U.S. Treasury Fiscal Data, Average Interest Rates on U.S. Treasury Securities; Federal Reserve Board via FRED, 10-Year Treasury Constant Maturity Rate.
Picture a 10-year note the Treasury sold in 2020 at less than 1%. It matures now and gets rolled into a new note above 4%. Multiply that across trillions of dollars of maturing securities and the picture looks bleak.
CBO’s ten-year baseline already shows where this leads. Net interest costs are near $1.0 trillion this year and roughly double to about $2.1 trillion by 2036.
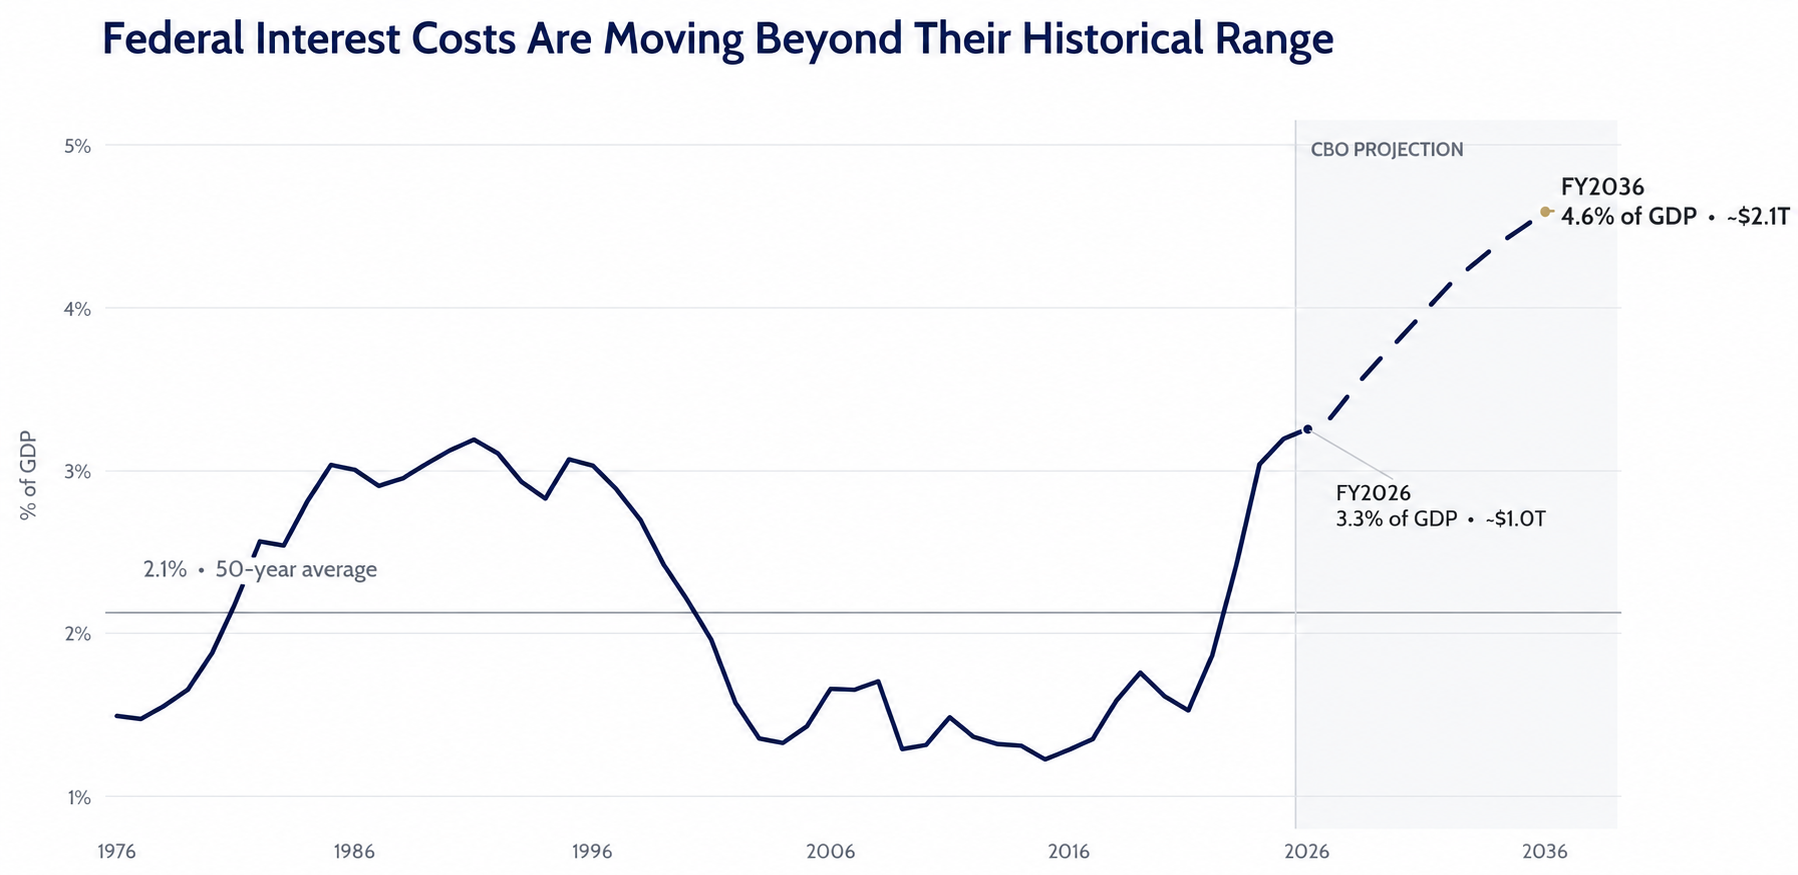
Net interest is already well above its 50-year average. CBO expects it to climb from 3.3% of GDP in 2026 to 4.6% by 2036, when interest would absorb nearly one-fifth of federal spending. Source: Congressional Budget Office, The Budget and Economic Outlook: 2026 to 2036; Office of Management and Budget historical data.
That turns interest into the fastest-growing part of the budget. It rises from around 3.3% of the economy today toward 4.6% over the decade. That’s a bigger claim on national output than at any sustained stretch in the agency’s records. CBO’s long-term outlook projects that interest will eventually cost more than either Social Security or Medicare.
The maturity mix makes the timing more important. A large share of the debt is short-term, so it reprices within months rather than years. That spreads less risk today but pulls the next refinancing date closer. Selling more long bonds locks in funding for decades and removes the rollover problem, at the cost of whatever premium investors want to hold that much duration. No mix of maturities makes the deficit itself smaller.
Then the loop closes on itself. More debt means more interest. More interest means larger deficits. Larger deficits mean more borrowing. If creditors also ask for a slightly higher yield because the path looks worse, every part of the cycle presses on the others.
A bond-market panic isn’t needed for the fiscal pressure to build. A gradual rise in the government’s cost of capital is enough to do real damage over time. Unlike a debt-ceiling standoff or a weak auction headline, it produces no single dramatic moment to react to.
What $40 Trillion in Debt Costs Households
Households don’t get a bill marked “your share of Treasury interest.” The cost reaches them through borrowing costs instead.
Freddie Mac’s weekly survey put the average 30-year fixed mortgage at 6.66% for the week ending August 27, with the 15-year at 5.98%. Mortgage rates don’t track federal debt directly. They move with Treasury yields, mortgage-bond spreads, credit risk, and lender margins. But sustained pressure on long-term Treasury yields tends to lift the floor under every rate built on top of them.
At 6.66%, principal and interest on a $400,000 loan comes to about $2,571 a month. Drop the rate by half a point and the same loan costs roughly $2,440. That difference, about $131 a month, adds up to more than $1,500 a year. For a family weighing whether it can afford a first house, a modest move in long-term rates can settle the question.
Other consumer debt carries the same imprint. Fed data showed commercial-bank rates in the second quarter of 2026 averaging 7.14% on five-year new-car loans, while credit-card accounts carrying a balance were charged about 22%. Short-term benchmarks and borrower risk drive most of that, not the federal balance sheet. Still, an economy with a structurally higher risk-free rate is one where credit stays expensive across the board.
Businesses face the same hurdle. A company weighing a new production line, a warehouse, or an acquisition needs an expected return high enough to cover its financing costs. When a government bond with essentially no default risk pays more than 5%, fewer marginal projects make the cut. CBO calls this crowding out, and links rising federal debt to weaker private investment and slower growth over time.
Higher rates aren’t bad news for everyone. Savers who earned almost nothing on safe money through the 2010s now collect real income from Treasury bills, money-market funds and certificates of deposit. A retiree living on short-term interest may welcome the change. A first-time buyer carrying a credit-card balance meets the same environment on very different terms.
Bond investors face a subtler tradeoff. When market yields rise, the price of bonds already issued falls. A long-dated Treasury fund can post losses even as newly sold bonds look more attractive. Savers close to retirement sometimes learn that a “safe” fixed-income holding still swings in price when rates move quickly. The credit risk on a Treasury is near zero. The risk from its maturity is real.
Stocks feel the pressure as well. A government bond yielding more than 5% raises the return investors expect from taking additional risk elsewhere. Higher yields also reduce the present value of profits expected far into the future. Strong earnings can overcome that pressure, but they have to do the work.
Why Deficits Put a Floor Under Long Rates
The link between government debt and interest rates gets exaggerated in both directions. The version supported by the research is narrower.
A long-term Treasury yield has two main parts. One is what investors expect short-term rates to average over the life of the bond. The other is the extra payment they want for tying up money that long, a piece economists call the term premium. Federal Reserve policy still sets the short end. At its July meeting, the Fed held its benchmark rate at 3.5%-3.75% and said inflation was still running above its 2% target. Fiscal worries show up at the long end.
In May, Fed researchers published a working paper estimating that each additional percentage point of expected debt-to-GDP raises the long-run neutral rate by 1 to 2 basis points. The 10-year term premium rises by two to three.
A few basis points sounds like nothing. Applied to a debt measured in tens of trillions, and repeated across years of new issuance, it stops being nothing. A separate CBO analysis points in the same direction. It finds that large and growing debt tends to raise long-run rates, slow growth, and send more interest income to foreign holders of Treasuries. Money paid as interest to a bondholder in Tokyo or London is income that leaves the U.S. economy rather than circulating inside it.
The starting point is supply. When spending exceeds revenue, the Treasury covers the shortfall by selling securities. Buyers have limited balance sheets and other places to put their money. Say a pension fund or a foreign central bank is asked to take down another block of 30-year bonds, with nothing else about the world changed. The clearing price drifts lower, and the yield drifts up.
Expectations do the rest of the work. An investor buying a 30-year bond is taking a view on three decades of inflation, Fed decisions, deficits, and the supply of competing bonds. A policy path that implies steadily rising debt can widen the premium investors require for committing capital over that period.
Foreign Buyers Aren’t Leaving, but They Are Repricing
Demand for Treasuries is still enormous. Foreign investors held about $9.3 trillion of them in mid-2026, according to the Treasury’s international capital data. Roughly $3.8 trillion of that is held by foreign governments and central banks.
That depth matters, but it doesn’t mean investors will absorb unlimited amounts of debt at any price. Bond markets adjust through yield. A fiscal problem doesn’t need investors to walk away. It only needs them to ask a little more each time to keep taking down the supply.
The base of buyers is also wide. Japan holds around $1.1 trillion of Treasuries, more than any other foreign government, with the United Kingdom and China next in line. Individual countries trim their holdings for reasons unrelated to U.S. solvency, ranging from currency management to their own liquidity needs.
Official reserve managers have been diversifying their holdings, and some of that has shifted into gold. For a household, the logic scales down. A portfolio built entirely from assets that respond to a single interest rate and policy cycle carries a risk that’s easy to miss until the cycle turns.
The Tax Debate Is Really Budget Arithmetic
Crossing $40 trillion doesn’t automatically trigger a tax increase. No law links a debt level to a tax rate. Congress sets taxes and spending, and it can change both.
What a rising debt does is narrow the choices. Every dollar that goes to interest has to come from somewhere else. That means more borrowing, higher taxes, or less spending on everything the government also wants to do.
CBO’s projections assume revenue holds near its long-run share of the economy, around 17.5% of GDP, while spending stays well above 23%.
That gap isn’t the result of a single bad year or event. Current law builds it in. CBO projects it will add up to $23.1 trillion in deficits from 2026 through 2035.
The IMF’s 2026 review of the U.S. economy was blunt about the fix. Its board said closing the gap would take both higher federal revenue and a rebalancing of Social Security and Medicare. The same review warned that continued large deficits and a rising debt ratio “create a growing financial stability tail risk” for the United States and the world. Treasuries sit at the center of global finance, which is what makes the risk systemic.
CBO Director Phillip Swagel was just as direct in February. The budget projections, he wrote, “continue to indicate that the fiscal trajectory is not sustainable.” Neither statement forecasts a crisis. Both describe a path that current policy can’t hold forever without some mix of faster growth, lower spending, higher taxes, more inflation, or a heavier interest bill.
Timing makes the problem harder. The longer policymakers wait, the more debt accumulates before any adjustment begins. Rising interest costs then absorb part of whatever tax increase or spending reduction eventually arrives, leaving less of that adjustment available to narrow the underlying deficit.
The debate then turns to who absorbs the adjustment. Which taxes rise, and on whom. Which programs grow more slowly. Which deductions get trimmed. How much of the gap growth can close on its own. Reasonable people land in very different places on those questions. The arithmetic underneath them doesn’t move.
That also shapes how households should think about future taxes. No one can say today which families will pay more a decade from now. The mix could run through income taxes, payroll taxes, narrower deductions, tariffs, or consumption taxes. What’s already fixed is that interest on past borrowing has first claim on future revenue. Everything else, from infrastructure to defense to tax relief to the next downturn, competes for what is left.
Fiscal Room Is Insurance the Country Is Spending
Washington borrowed aggressively during the 2008 financial crisis and again during the pandemic. In both cases, emergency spending helped limit the economic damage.
That capacity to respond is the real casualty of a rising debt. A government with a moderate load can borrow hard through a recession, a war or a pandemic without forcing immediate tax increases or spending cuts. A government entering the next crisis with much higher debt and interest costs can still borrow. But it does so on top of a bigger interest bill, and the market response may be sharper. CBO warns that a large existing debt can make policymakers more reluctant to lean on deficit spending when they need it most.
The baseline keeps pointing the same way. CBO’s outlook expects the annual deficit to widen from $1.9 trillion this year to $3.1 trillion by 2036. Debt held by the public keeps climbing as a share of the economy.
Those are projections under current law, and there’s a lot that could change them. Tax and spending policy will shift. Growth, inflation, immigration and productivity could each run above or below what the models assume. The agency stresses the wide band of uncertainty around its own forecasts. Uncertainty runs both ways, though, and nothing guarantees the surprises will be the helpful kind.
Faster growth is the most painless way out, and also the least certain. Stronger productivity lifts incomes, profits, and tax receipts while enlarging the economy against which the debt is measured. But growth has to outpace the fiscal gap to stabilize the ratio, and a stronger economy can keep real interest rates elevated. It’s a race the government isn’t guaranteed to win, even in a good decade.
Markets are already charging for the trajectory. The August 30-year sale cleared at its highest yield since 2001. Michal Stanczyk, a portfolio manager at Allspring Global Investments, told Bloomberg the auction would “clear without difficulty.” He added that “a successful auction shouldn’t be confused with strong structural demand for long-duration assets.”
It’s tempting to read $40 trillion as a household maxing out a credit card. But the comparison breaks down fast. The federal government taxes a continental economy, prints the currency it borrows in, and has no retirement date. A family has none of that. What it shares with a family is narrower. Past a certain point, interest payments start crowding out the rest of the budget, and this debt is past that point.
The US still has advantages few other countries do. It taxes a vast economy, holds the world’s benchmark safe asset, and borrows in its own currency. But those advantages only buy time, though. The interest clock is already running.